Getting Started: How to Quickly Configure and Use Monitoring and Alerting Rules
Applicable Scenarios
If you have configured an ETL pipeline, such as completing the Getting Started: How to Quickly Configure, Orchestrate, and Schedule ETL Pipelines, and plan to add monitoring for task execution stability and data quality checks of the output, and send alert notifications when anomalies occur, it is recommended to read this guide.
Prerequisite Reading
Before reading this guide, it is recommended to complete reading and understanding the following documents:
Operation Guide
The "Monitoring and Alerting" product module of Lakehouse Studio provides a powerful set of features that allows users to monitor key metrics such as task running status in real-time through system built-in rules or custom rules. Once an anomaly is detected, the system will send timely alert notifications to help you ensure the stability and reliability of data flows.
Usage Notes
Users with workspace_admin, workspace_dev, or workspace_sre role permissions can use the "Monitoring and Alerting" feature.
Steps
Entering the Monitoring and Alerting Module
-
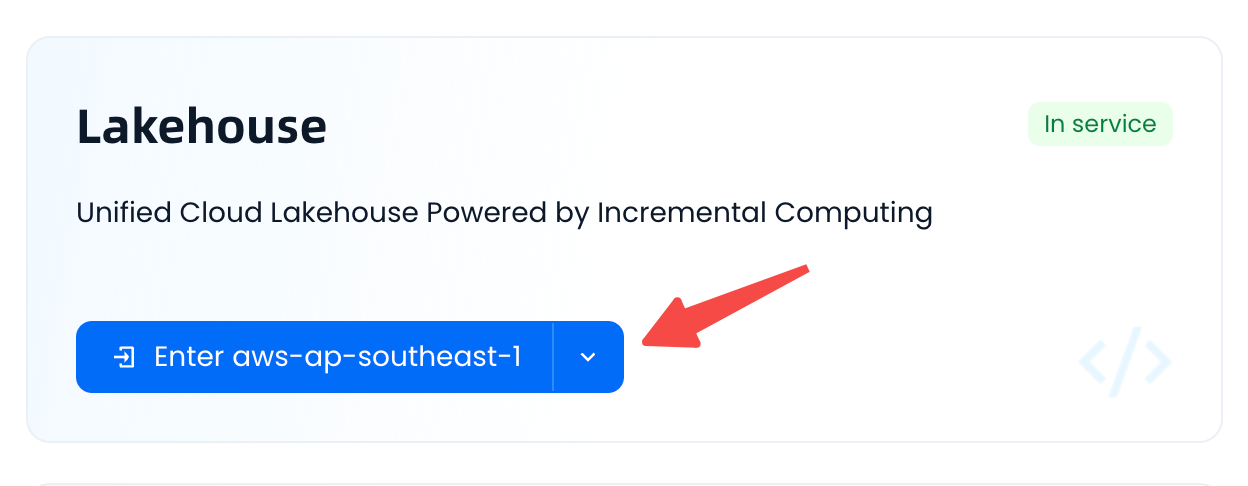
click the button to enter the Lakehouse service instance.
-
Navigate to "Operations Monitoring" > "Monitoring and Alerting" page:
Using Built-in Rules
As mentioned above, the product has built-in global monitoring rules available for selection and activation.
-
As mentioned above, the product has built-in global monitoring rules available for selection and activation. There are mainly two types of built-in monitoring rules: "Periodic Task Instance Execution Failed" and "Data Quality Check Failed".
-
Click a specific monitoring rule to view its detailed configuration definition. Taking "Data Quality Check Failed - Strong Rule" as an example, the following figure shows its core information such as monitoring items, alert notification methods, and notification recipients.
- Monitoring Item: Strong blocking scheduled quality rule verification failed.
- Alert Notification: For critical-level rules, according to the notification policy definition (not expanded here, see related documents for details), phone alerts will be pushed.
- Notification Recipients: By default, the object owner will be notified. For data quality rules, the rule creator is notified by default.
-
Enable built-in global alert rules and subscriptions, continuing with "Data Quality Check Failed - Strong Rule" as an example:
- Click "Enable" to activate this rule [1]. According to the rule definition, this alert will be sent to the object owner, i.e., the creator of the quality rule.
- If you are not the object owner (e.g., not the creator of the quality rule) but also want to follow this alert, you can click the "Subscribe" button [2].
Custom Monitoring Rules
Built-in rules primarily provide overall monitoring from a global dimension, facilitating quick use. However, in practice, for some specific objects, there is also a need for finely-grained custom monitoring. In such cases, custom monitoring rule capabilities are needed.
The following example will demonstrate how to monitor the instance execution failure of a specific periodic scheduling task and alert via phone. The main steps are as follows:
-
In the "Monitoring Rules" list, click the "Create Rule" button.
-
In the Create Rule dialog, fill in the required information for the rule and save.
- Monitoring Item: Task instance execution failed. Use filters to select the specific task name.
- Alert Notification: Set the level to "Warning" and use the "General Notification Policy" to send SMS alerts. The notification recipient defaults to the current operator.
-
After the rule is created, a record will be displayed in the list:
-
Observe how the monitoring rule works.
-
Here, we perform a simulated error change: modify the SQL logic of the monitored task, use an incorrect field name, then submit for scheduled execution to trigger a scheduling instance execution failure.
-
After the task is scheduled and executed and a failure occurs, you can observe the working status of the monitoring alert rule in "Monitoring and Alerting", which is as expected:
-
In "Alert Events", you can see a new alert event added.
-
In "Notification History", you can see the specific alert notification push status.
-
-
At this point, the configuration of built-in and custom monitoring and alerting rules and the observation of their actual working results have been completed.
Related Documents
- It is strongly recommended that you further read the Monitoring and Alerting help document to understand the complete usage guide for the Monitoring and Alerting module, especially to further understand core concepts such as monitoring rules, notification policies, alert events, and notification history.
Next Steps
- None