Monitoring and Alerting
Overview
The monitoring and alerting system is a powerful feature set that allows users to monitor key indicators such as task run status in real time using system built-in rules or custom rules. Once an anomaly is detected, the system sends timely alert notifications to help you ensure data flow stability and reliability.
Core Concepts
| Concept | Description |
|---|---|
| Monitoring Rule | A set of configuration information containing key attributes such as specific objects and message types, informing the system which key messages to watch for. Rules configured for specific objects and specific conditions generate alert events when conditions are met. |
| Alert Event | Based on monitoring rules, a potential event record that needs to trigger an alert notification when monitoring conditions are satisfied. |
| Notification History | The actual notification records pushed to users after alert events are generated. Alert notification delivery is influenced by the following three strategies. |
| Notification Strategy | Defines which notification channels to use, sending frequency, etc., when pushing alerts to recipients. |
Monitoring Rules
The monitoring rules list displays all currently configured rules. Users can filter to quickly find the needed rules.
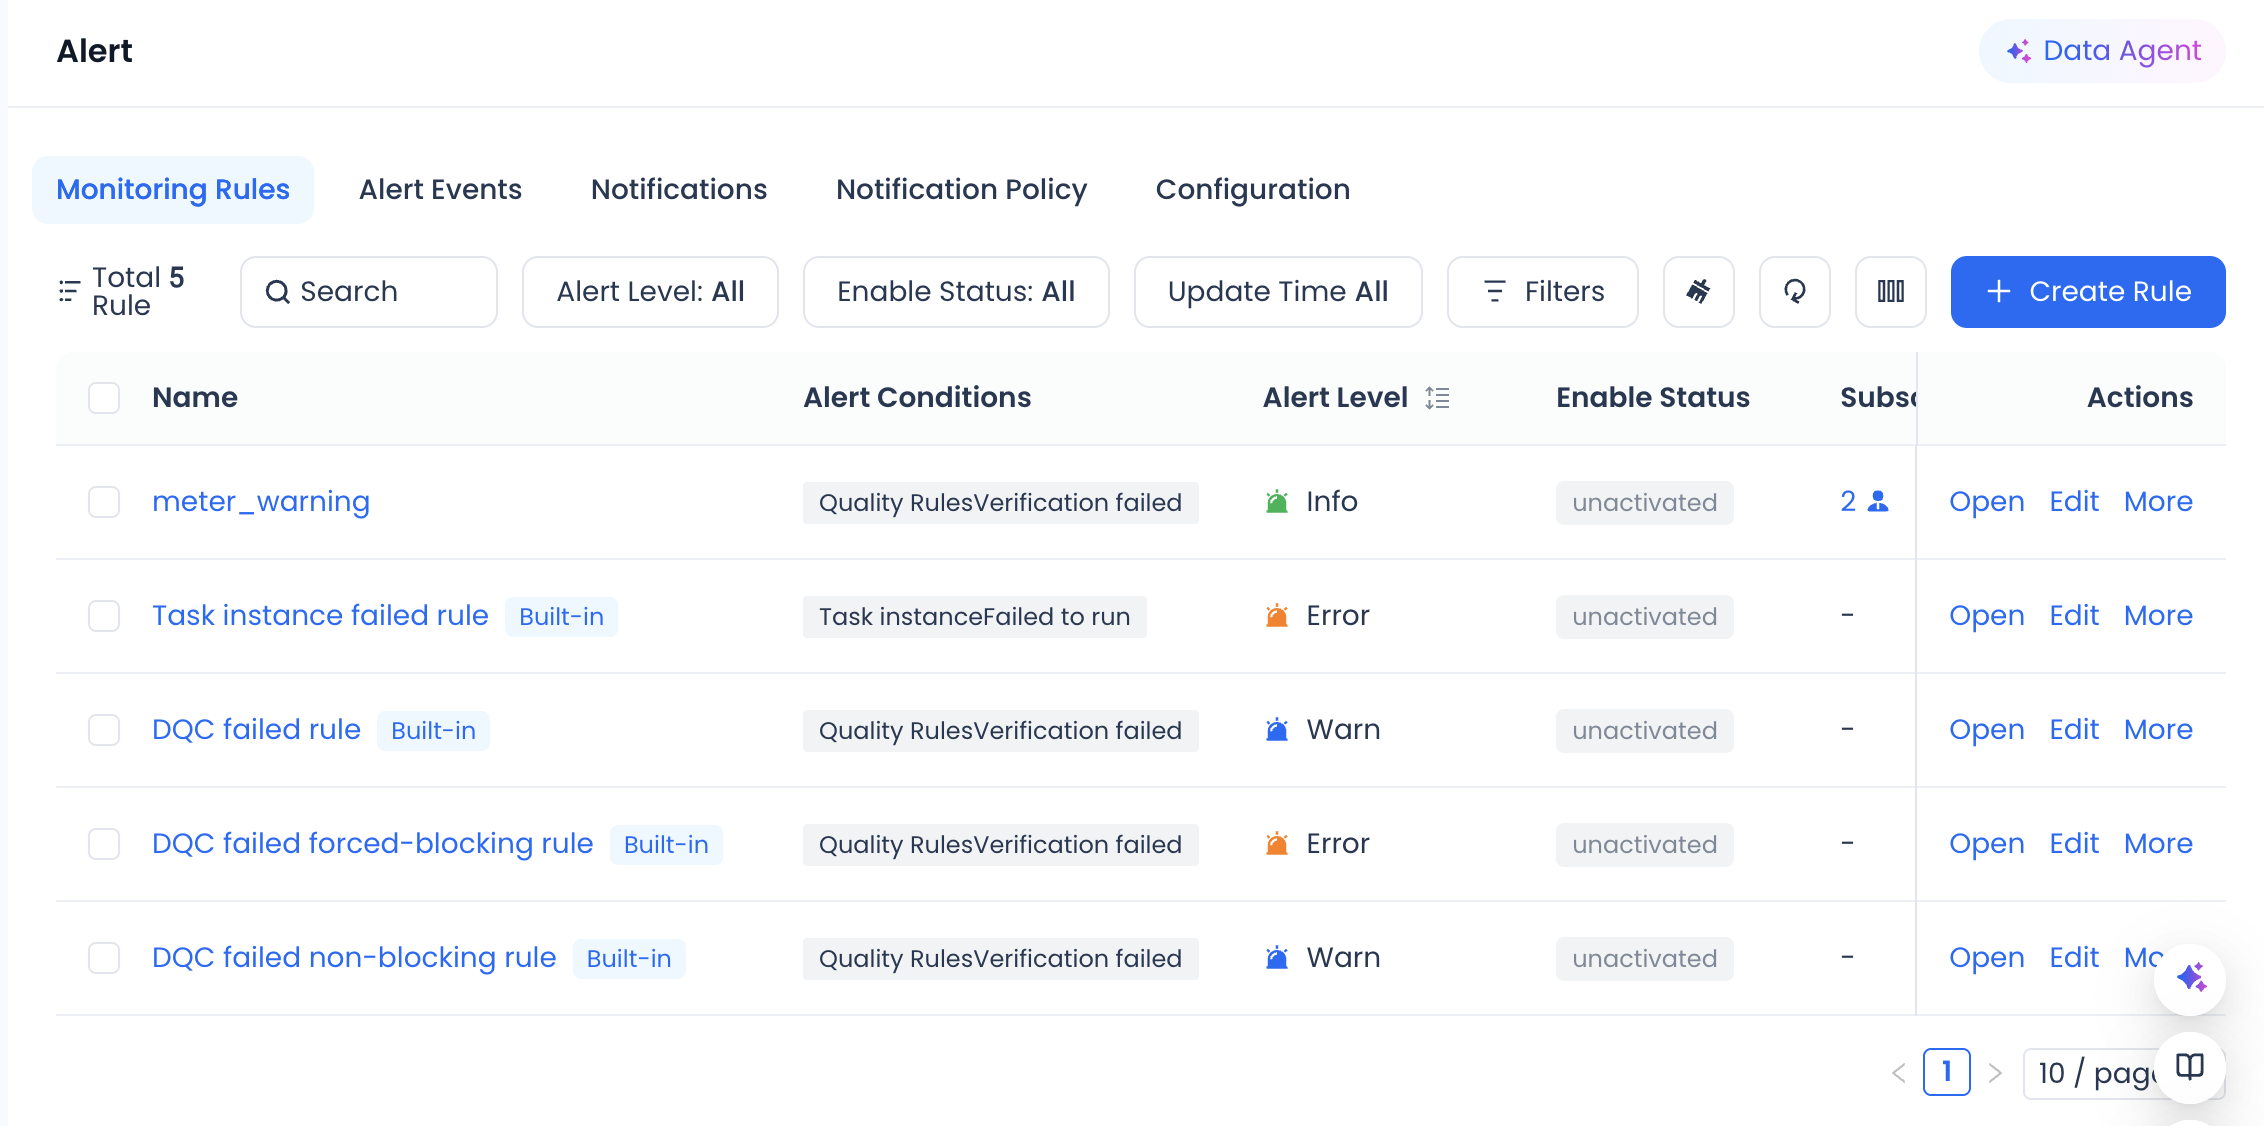
For individual rules, the following operations are available:
| Operation Name | Behavior Definition | Authorized Personnel |
|---|---|---|
| View Details | Open the monitoring alert rule details page to view complete information. | Open to all instance members |
| Enable/Disable | Enable or disable the alert rule. | Instance administrator, instance operations role |
| Copy | Copy the configuration attributes of the current rule to create a new rule. | Instance administrator, instance operations role |
| Edit | Modify the attributes of the monitoring rule through appropriate interactive methods. | Instance administrator, instance operations role |
| Subscribe/Unsubscribe | Add or remove the operator from the alert recipient list. | Open to all instance members |
System Built-in Rules
The system provides some preset global monitoring rules that users can enable as needed.
| Rule Name | Rule Function | Default Status |
|---|---|---|
| General Rule - Monitor Task Failure | Default rule for monitoring task instance failures. | Disabled by default |
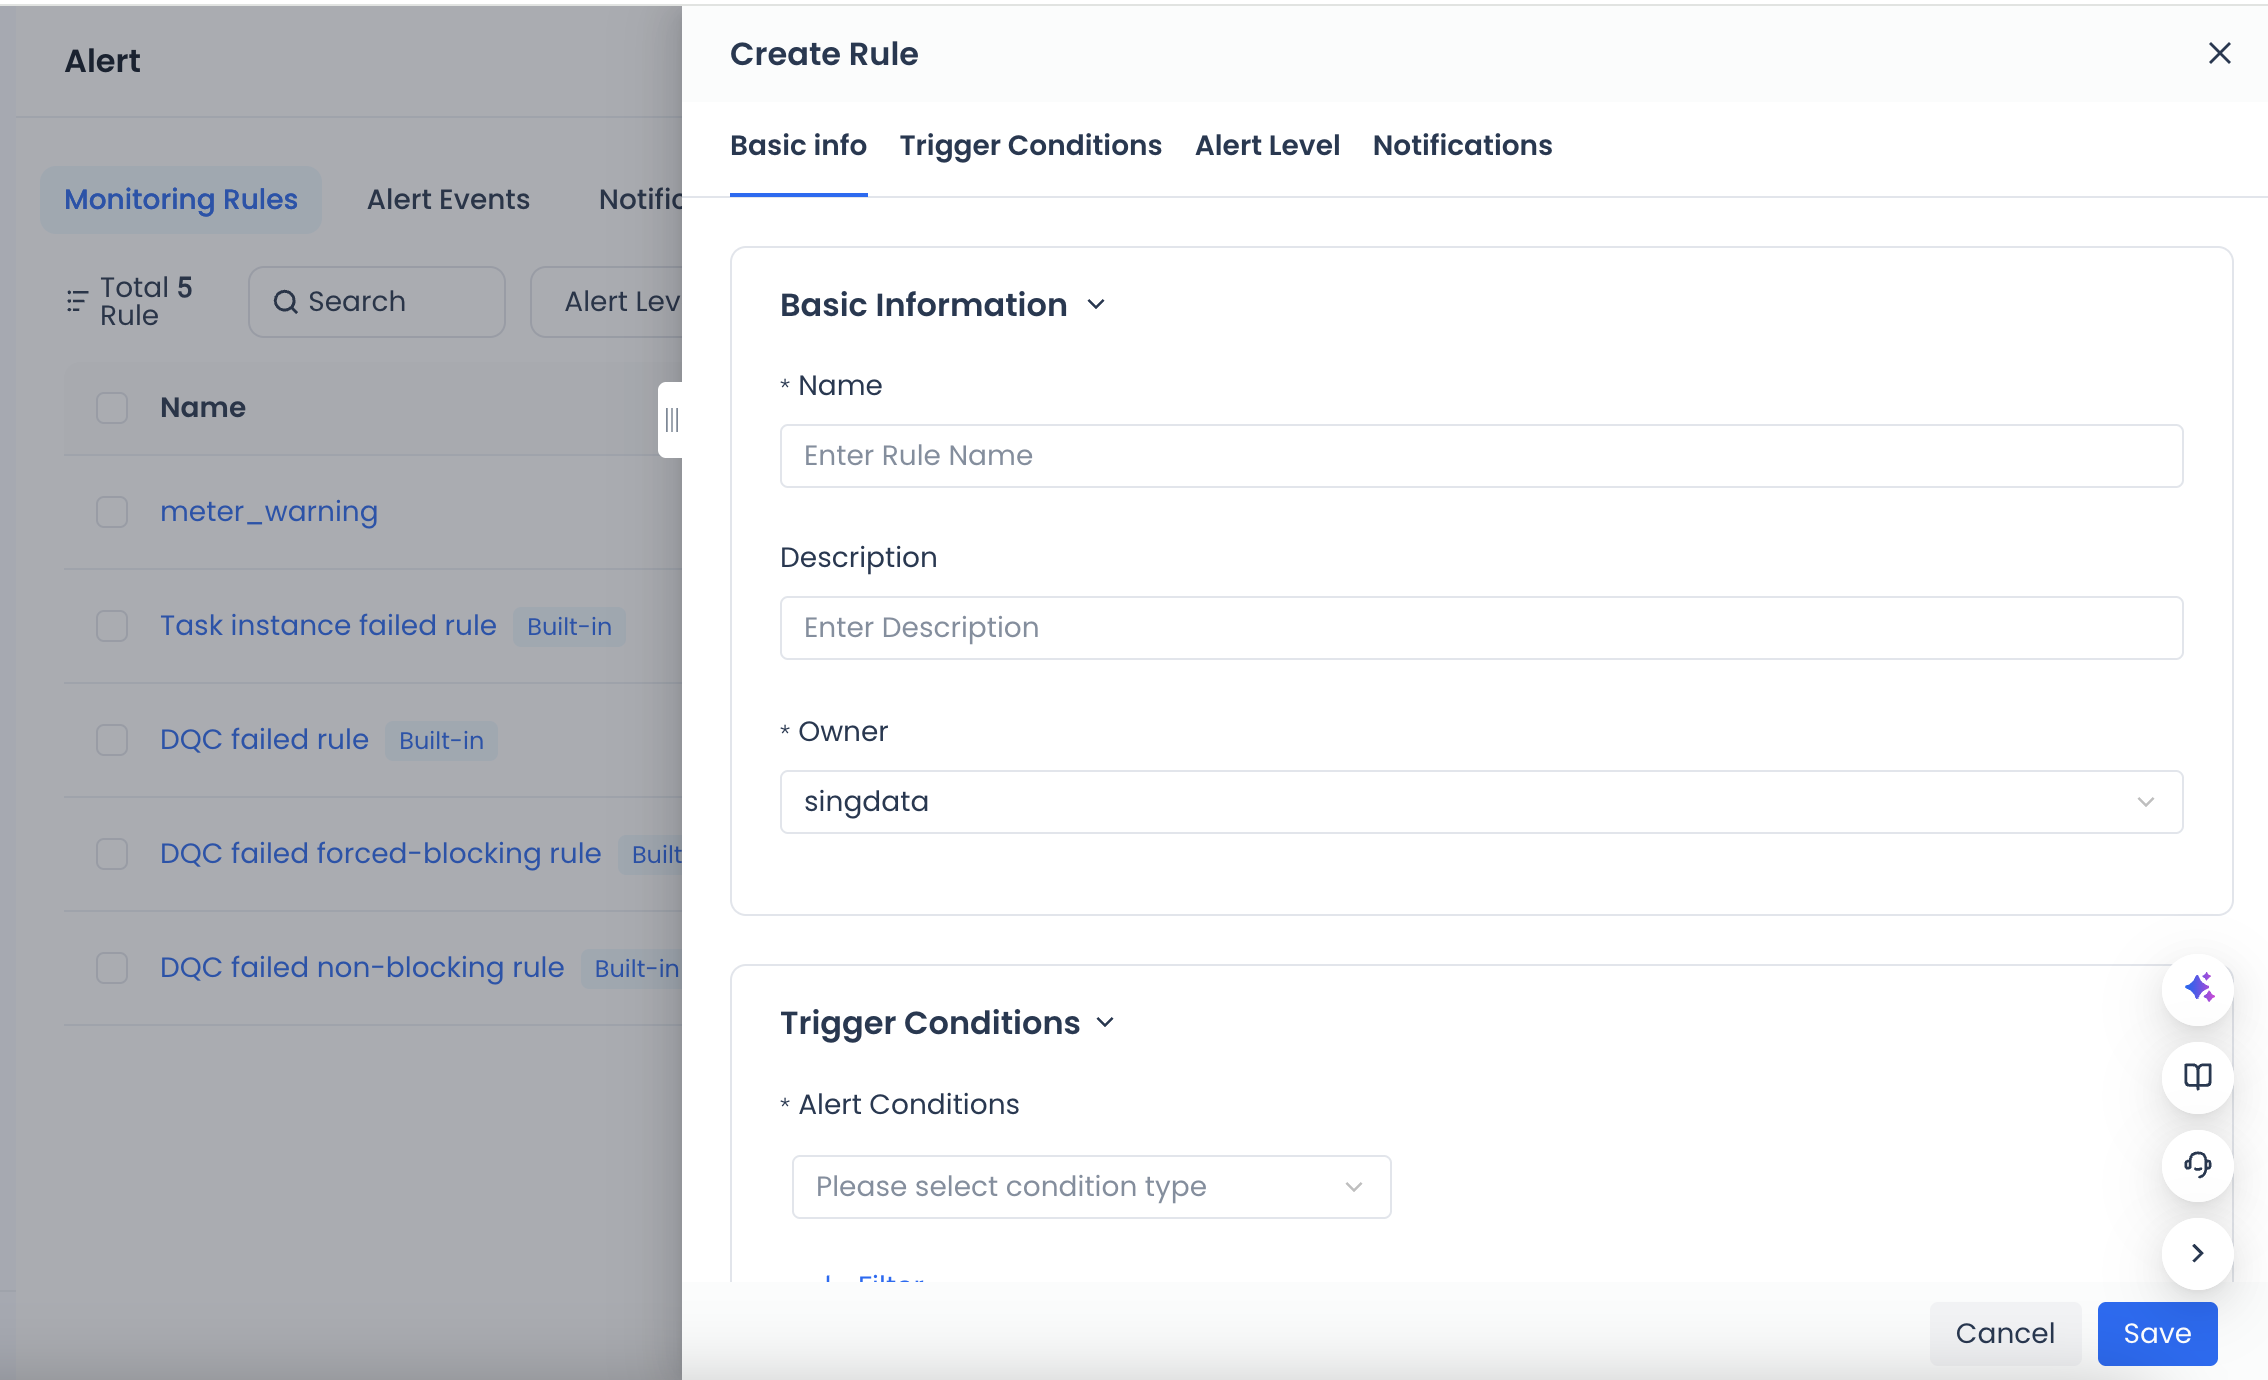
Create a New Monitoring Rule
Click the "Create Rule" button to create custom monitoring rules based on your needs.
| Category | Parameter | Description |
|---|---|---|
| Basic Information | Name | Enter the name of the new custom rule. |
| Description | Optional. You can add a description of the current rule or note the handling procedures after receiving an alert. | |
| Trigger Condition | Monitoring Items | The specific monitoring objects. The system currently supports "Event Monitoring" and "Metric Monitoring" two modes. |
| Filter Condition | Filter conditions for messages. Multiple conditions are combined with "AND". | |
| Alert Level | Alert Level | The alert level configuration in the universal template is as follows, and users can also customize notification methods for different levels in the notification strategy. Critical: Send via all alert channels, including phone. Severe: Send via all alert channels, including phone. Warning: In-system, email, SMS, Webhook, excluding phone. Info: In-system, email, Webhook, excluding phone and SMS. Clicking the alert level will link to the information displayed in the notification strategy list below. |
| Monitoring Notification | Notification Strategy | Click the dropdown to select a notification strategy managed in "Notification Strategy", or click the "+" button to create a new one. For configuration details, see Notification Strategy. |
| Alert Subscription | Dropdown to select the specific recipients to be notified for this rule. | |
| Webhook Notification | Select notification method. Currently supported types: DingTalk, Feishu. | |
| Notification Start Time | The start time for sending notifications after the monitoring rule is triggered. | |
| Notification End Time | The end time for sending notifications after the monitoring rule is triggered. |
Trigger Condition Rules
Trigger conditions consist of monitoring items, metric calculation methods, thresholds, and trigger methods. The system currently supports "Event Monitoring" and "Metric Monitoring" two types.
Metric-Based Monitoring Configuration
****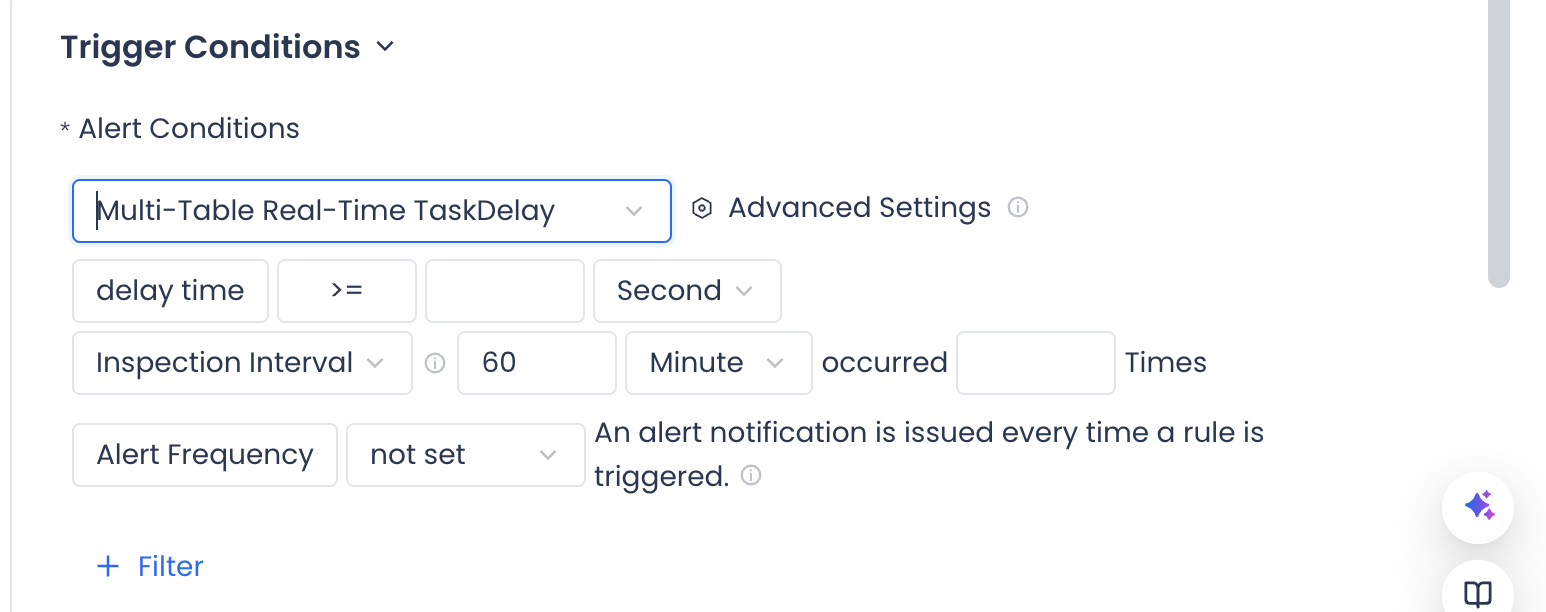
For metric monitoring, after defining the calculation method and threshold, two trigger methods are supported.
Continuous: Once the metric touches the threshold for N consecutive times, a monitoring alert is triggered.
Check Interval: Users define that when the threshold is touched a cumulative N times within the check interval, a monitoring alert is triggered.
Metric monitoring configuration: Users can define calculation methods and thresholds, and select trigger methods. For example, configure the full-incremental integrated sync task delay metric: delay time >= 50 seconds, continuous for 3 data points, alert frequency limited to once every 30 minutes.
At 00:40, when the threshold is exceeded for 3 consecutive times, the first alert is triggered. From then until 01:50, it remains in the first alert stage.
During the alert stage, subsequent time points are evaluated based on the alert frequency, determining whether to continue sending alerts. With the limit set to once every 30 minutes, alerts are sent at 01:10 and 01:40.
Starting from 02:00, the next three metric values are all below the threshold, so the first alert recovers and no further alert notifications are triggered.
If the user's trigger method is based on cumulative count within the check interval.
Event-Based Monitoring Configuration
Event monitoring generates alerts when specific events or conditions occur. Users can monitor based on operational instances or data quality validation rules within the product. Based on currently supported behaviors, event monitoring is mainly divided into two categories:
Task Operations: Various periodic scheduling tasks configured in development scenarios, or real-time running task instances.
Data Quality: Various table quality monitoring tasks configured in data quality.
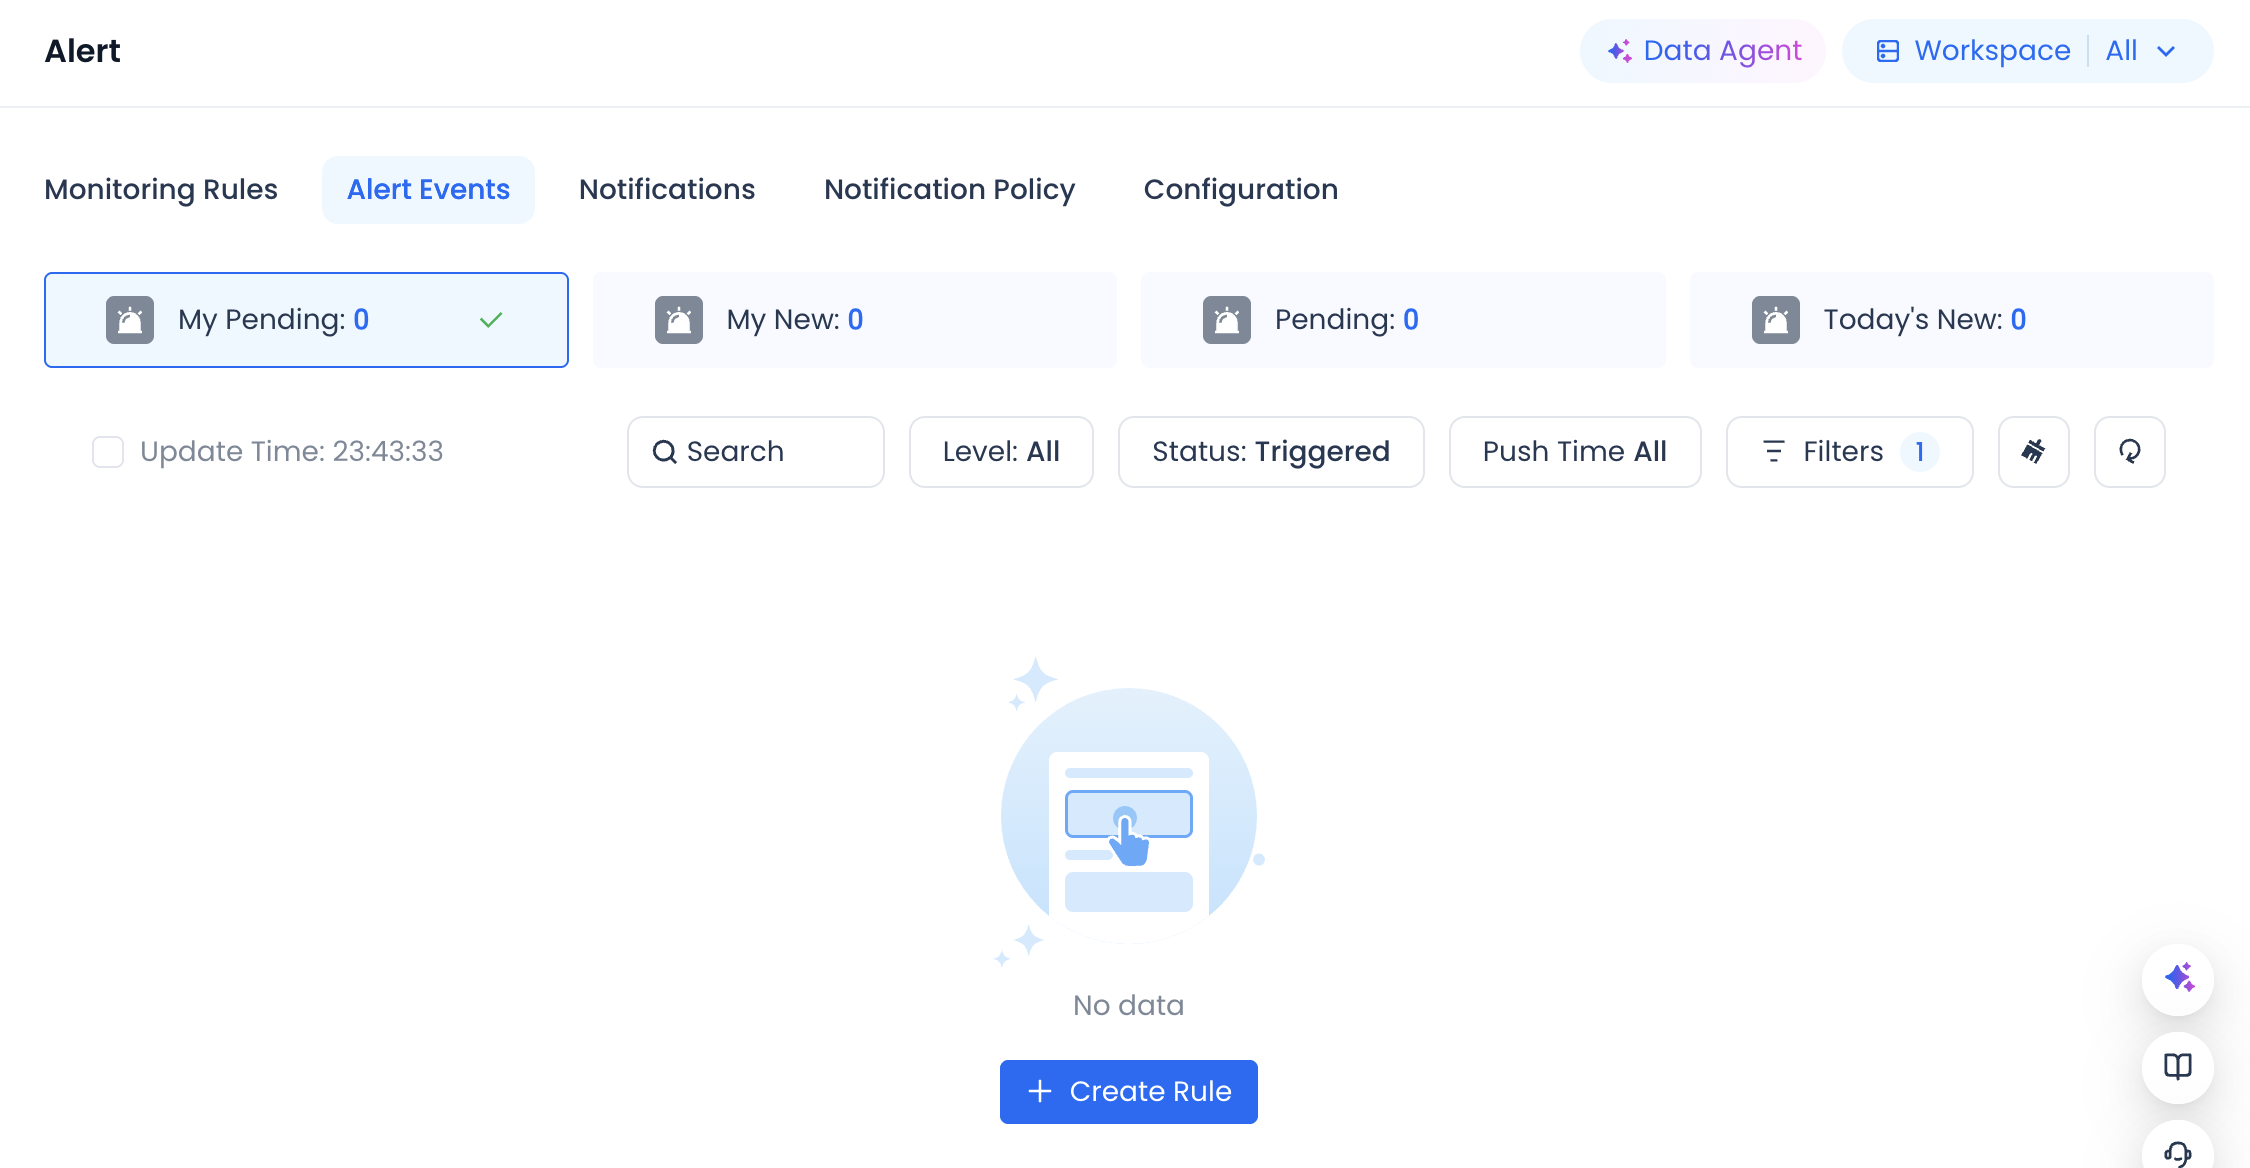
Alert Events
The alert event list displays all alert information generated after monitoring rules are triggered. Users can perform operations on alert events in the list, such as suppress or close.
Suppress: Set the current alert event to not send messages for a specified number of minutes.
Close: Close the current alert event and stop receiving such messages.
Alert Event Handling Operations
| Operation | Definition | Applicable Scenario | Scope |
|---|---|---|---|
| Suppress | Stop sending messages for the alert event within a specified time period. | A known issue is being addressed and repeated alerts are not needed temporarily. | Current alert event |
| Close | Close the alert event and stop receiving such messages. | Issue has been resolved or confirmed as a false alarm. | Current alert event |
| Auto Close (not triggered by clicking on the alert event) | The system automatically closes the alert after detecting issue recovery. | Task instance rerun succeeds, manually set to success. | Related alert events |
Notification History
Notification history records all notification messages actually delivered based on notification strategies.
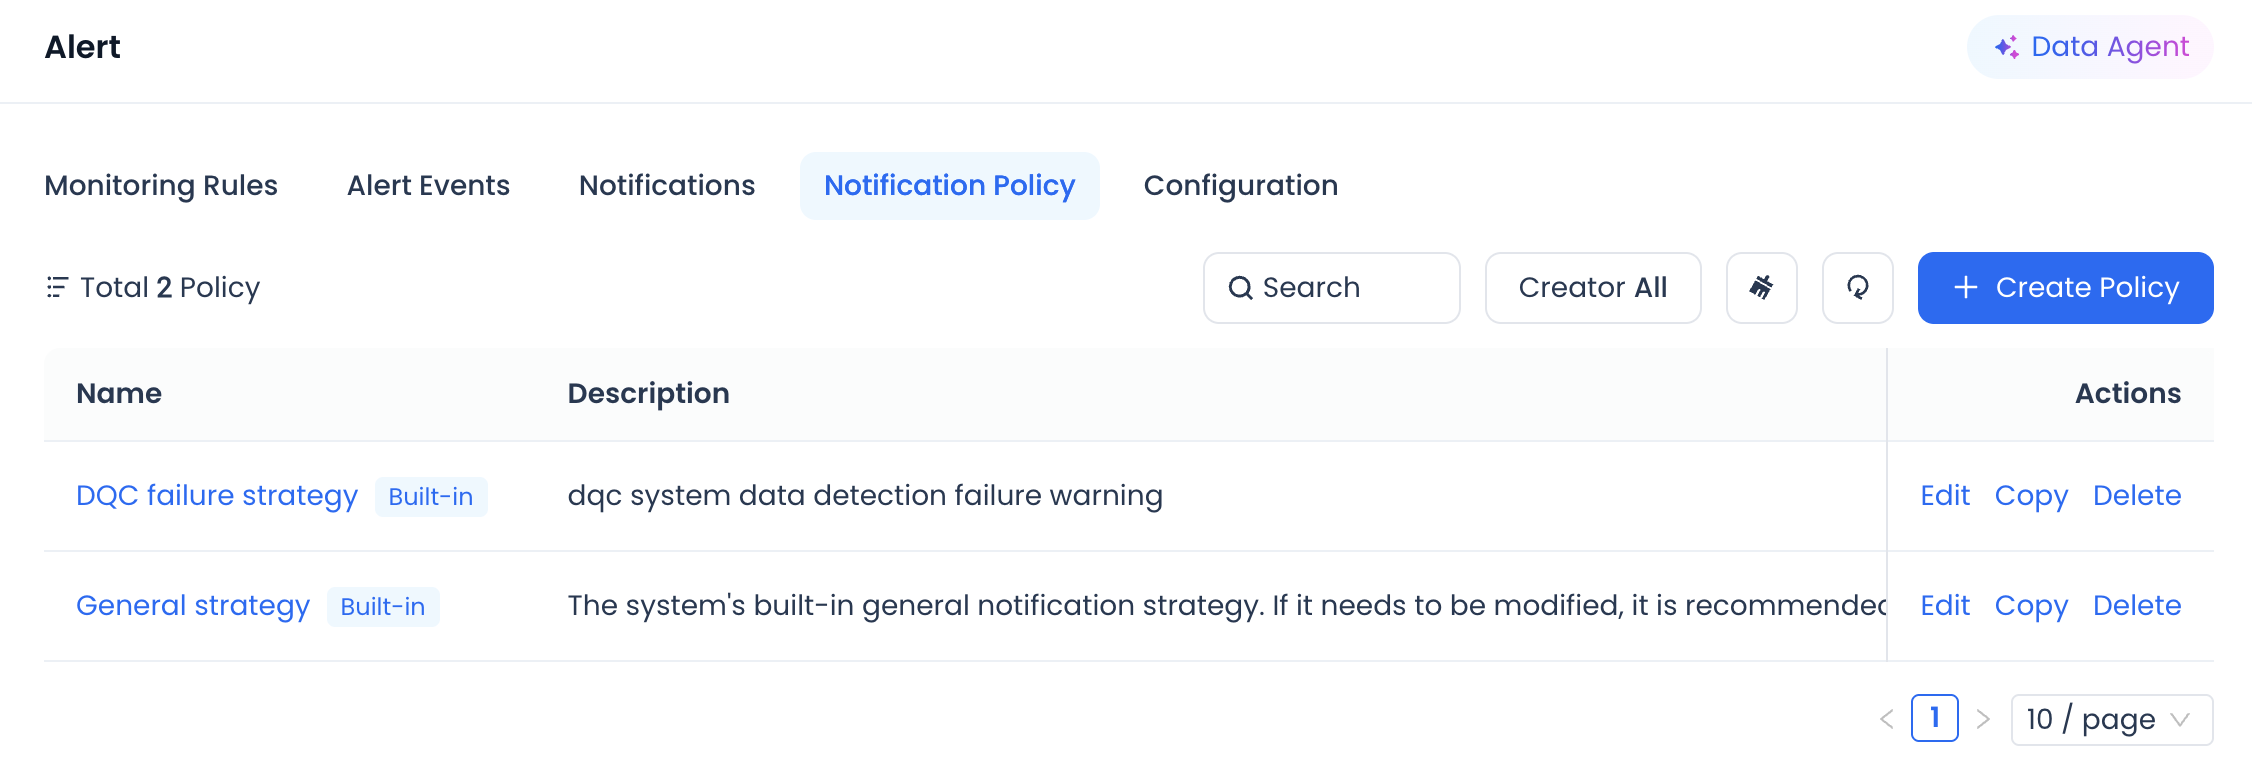
Notification Strategy
The notification strategy list displays all defined notification strategies. Users can search and filter.
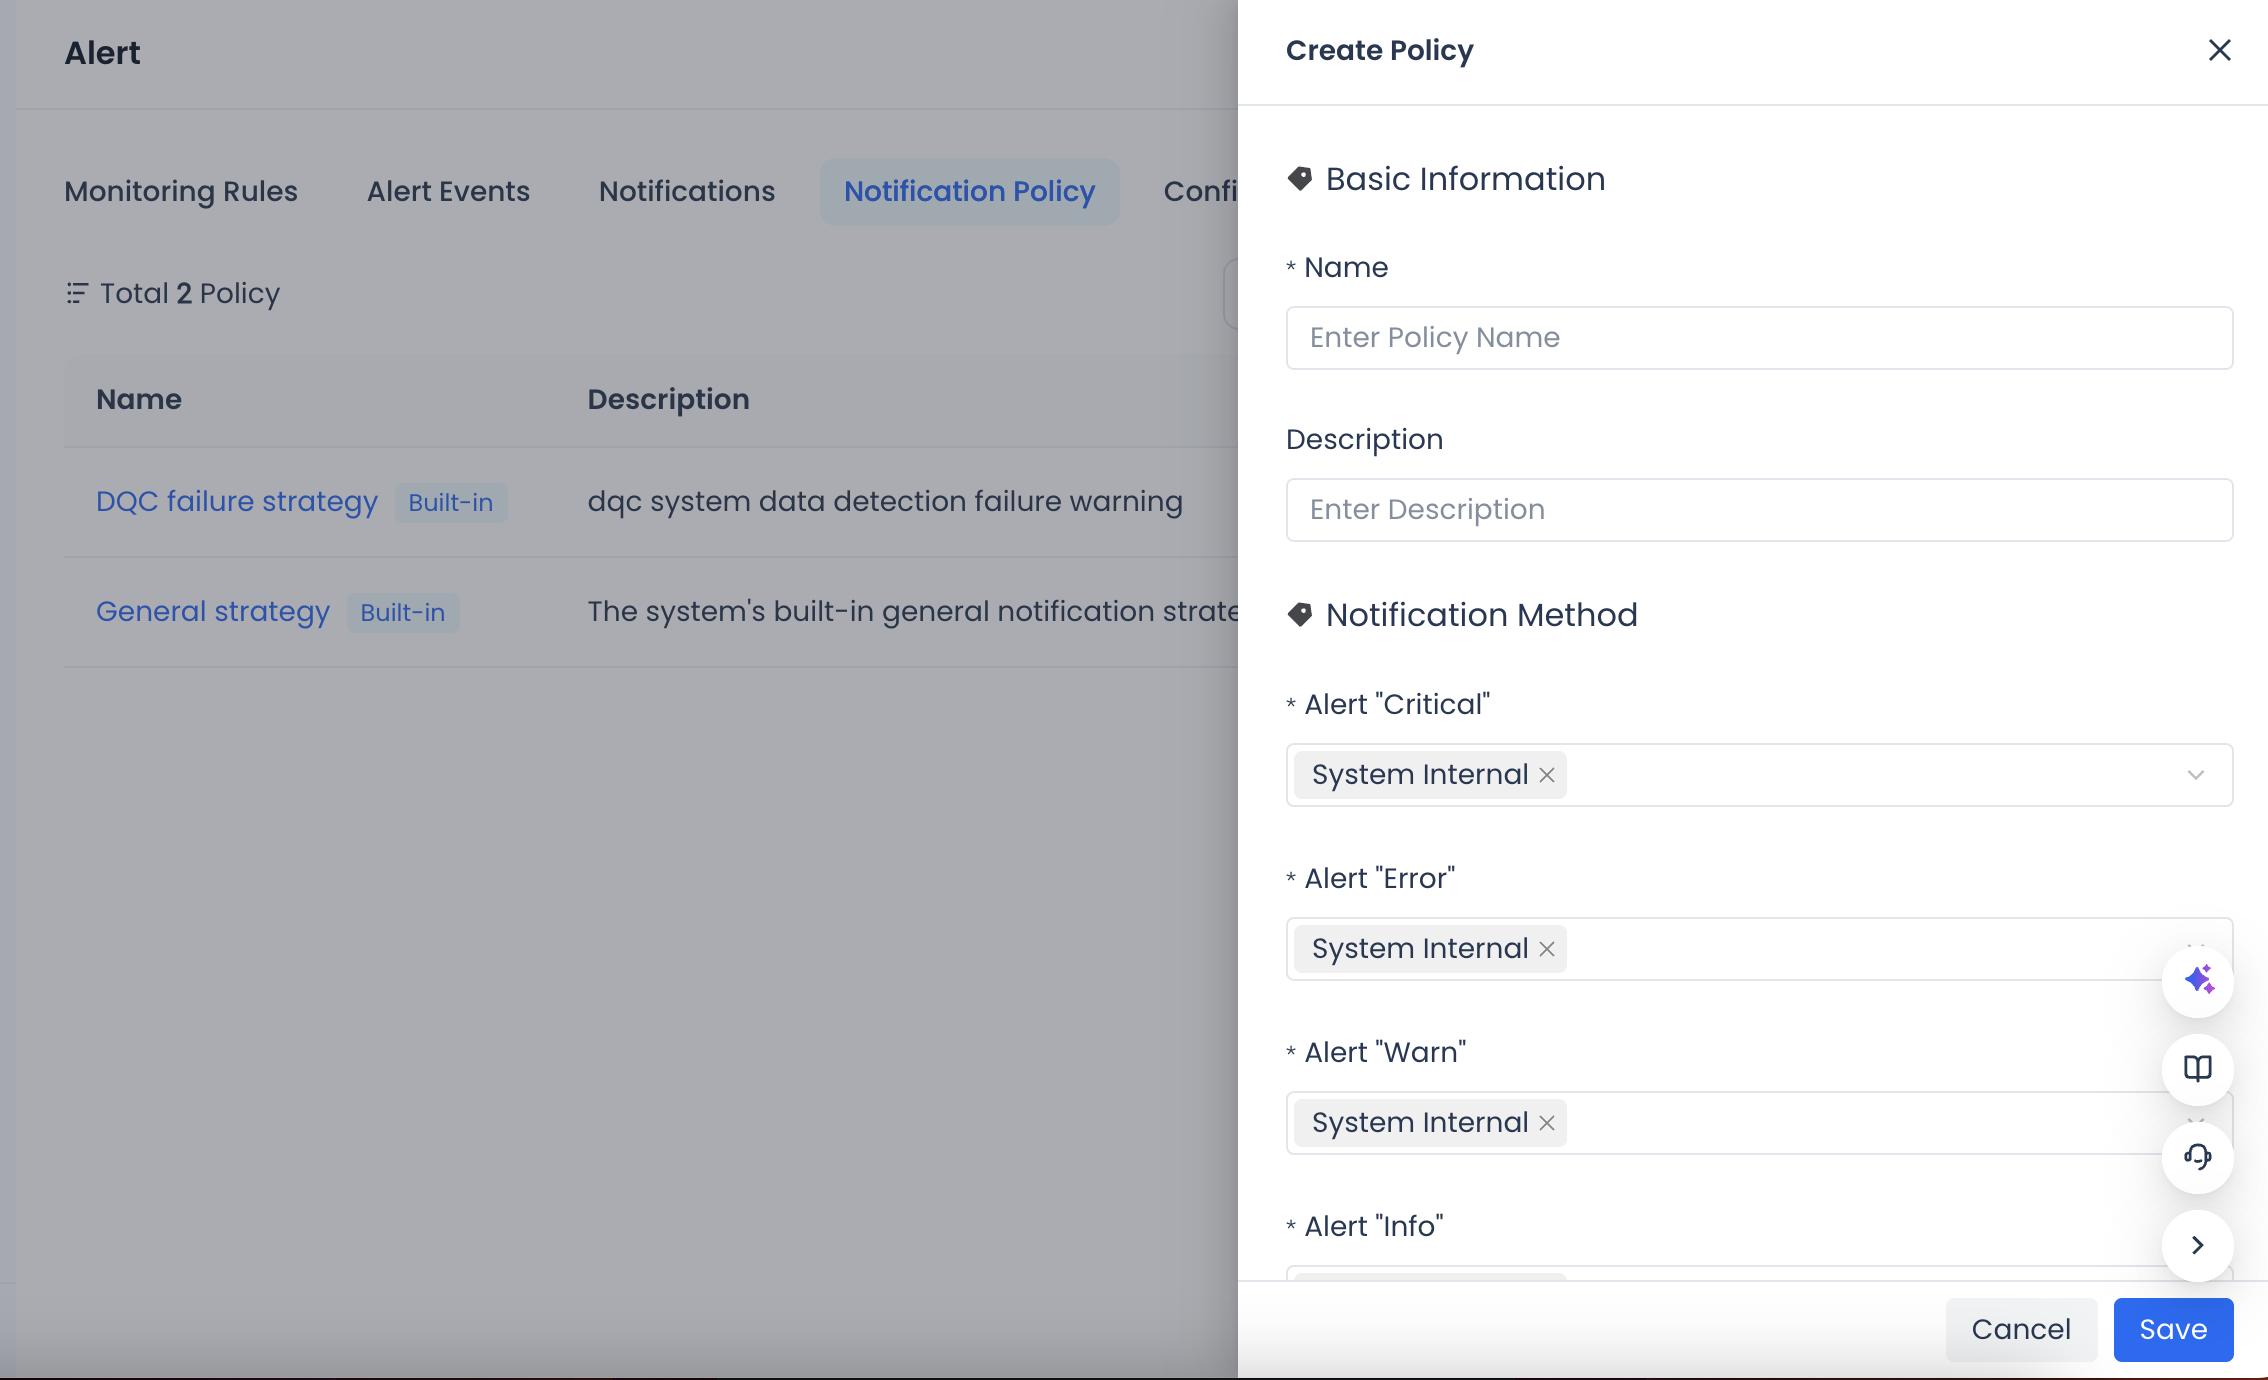
Create a New Notification Strategy
Users can click the "Create Strategy" button to create a new notification strategy based on their needs.
| Category | Parameter | Description |
|---|---|---|
| Basic Information | Name | The name of the notification strategy. |
| Description | Optional. You can add a description of the current rule. | |
| Notification Method | Critical Alert | Set the specific notification method for different alert levels. Supported methods: Webhook, SMS, Phone. |
| Severe Alert | ||
| Warning Alert | ||
| Info Alert | ||
| Notification Time | Send Interval (minutes) | The time interval between two alerts. |
| Max Send Count | The maximum number of alerts. After exceeding this count, no more alerts will be generated. | |
| Do Not Disturb Start Time | During the do-not-disturb period, the system will not send alerts. For example, if a task failure alert is configured and the do-not-disturb time is set from 00:00 to 08:00, no alert will be sent during that period. If at 08:00 the task is still in an abnormal state, an alert will be sent. | |
| Do Not Disturb End Time |
Configuration Management
Configuration management allows users to configure personal information and Webhooks.
Personal Configuration
Users can modify their phone number and email address used for receiving alerts, and set do-not-disturb periods in personal configuration.
Webhook Configuration
Webhook configuration is used to define Webhook channels for alert delivery. Currently supports Feishu and DingTalk.
Create a New Webhook Configuration
Users can click the "Create Configuration" button and fill in the required parameters to create a new Webhook configuration. It is recommended to test before saving to ensure the configuration is correct.
Other
Automatic Closure of Monitoring Alerts
For monitoring alerts on task instance run failures, after the Operations Center handles the instance and it recovers successfully (such as manually setting success or rerunning the instance successfully), the corresponding alert event will be automatically set to closed. No manual closure is needed.
Webhook Alert Security Settings
For IM platforms such as DingTalk, Webhook alert delivery has certain security settings. Add "Singdata" as a custom keyword in the security settings.