Performance Benchmarks for Fully Managed Log Query

You need reliable log management to keep your systems running smoothly. Performance Benchmarks help you measure how well platforms handle your logs. Key metrics include query latency, throughput, concurrency, data freshness, and scalability. Today, companies demand quick results, fresh data, and strong scalability. The global log management market keeps growing fast.
Key Takeaways
Understand key performance metrics like query latency, throughput, concurrency, data freshness, and scalability to evaluate log query solutions effectively.
Aim for low query latency to ensure quick responses, which helps in identifying issues before they escalate.
Regularly review performance benchmarks to maintain system efficiency and adapt to changing business needs.
Key Performance Benchmarks

When you evaluate fully managed log query solutions, you need to understand the main Performance Benchmarks. These benchmarks help you measure how well a platform works for your needs. Each metric gives you a different view of system performance.
Query Latency
Query latency tells you how fast a system can answer your questions. Low latency means you get results quickly. High latency can slow down your work and make it hard to react to problems. Industry reports break down query latency into several parts:
Component | Description |
|---|---|
Network latency | Time for data to travel between points |
Processing latency | Time for systems to compute and process information |
Market data latency | Time from exchange event to receipt |
Order processing latency | Time from order submission to acknowledgment |
Wire-to-wire latency | Total round-trip time for a complete transaction |
Hardware-based measurements | Specialized hardware timestamps for nanosecond precision |
Software-based measurements | OS timestamps and application-level metrics |
Critical measurements | Round-trip time, one-way latency, jitter, queue depth |
Best practices | Precision time sync, redundant measurement points |
Regulatory considerations | Timestamp accuracy, audit trail capabilities |
You should always look for platforms that keep query latency low. Fast responses help you spot issues before they grow.
Throughput
Throughput measures how much data your system can handle in a set time. High throughput means you can process more logs and run more queries without delays. You can improve throughput by following best practices:
Detach logs from the devices that create them.
Capture data from many sources for better visibility.
Use structured logging for easy searching.
Send logs to a central place, not your production servers.
Index logs to speed up searches and diagnostics.
You can also use a dedicated monitoring cluster. This helps you track search and indexing activity. By tuning settings like bulk size and refresh interval, you can boost throughput, especially when you have lots of data.
Concurrency
Concurrency shows how many users or queries your system can handle at once. High concurrency means your team can work together without slowdowns. To measure concurrency, you can follow these steps:
Define test scenarios and find areas where many users act at once.
Set realistic patterns and goals based on how your team works.
Design tests for different user roles and actions.
Pick tools to simulate users and monitor the system.
Increase the number of users step by step.
Watch key metrics like response time and error rate.
Study the results and fix any problems.
Improve code and scale up resources if needed.
Add caching to reduce load.
Share results with your team for future planning.
Some top log query platforms, like Apache Doris, can handle over 30,000 queries per second per node after tuning. They also show big drops in query latency, making them great for busy teams.
Data Freshness
Data freshness tells you how up-to-date your logs are. Fresh data is key for making smart choices. If you use old data, you might miss important changes or make mistakes. Here is why data freshness matters:
Fresh data helps you avoid bad decisions.
It lets you react quickly to changes in user behavior.
It gives you accurate insights for your business.
It supports real-time monitoring and fast responses.
You should always check how fast your platform updates log data. This keeps your monitoring and alerts reliable.
Scalability
Scalability means your system can grow as your data grows. You want a platform that handles more logs and users without slowing down. Industry benchmarks use these metrics to measure scalability:
Metric | Description |
|---|---|
Throughput | How many requests the system handles in a set time. |
Latency | How long it takes to get a response. |
Time To First Token (TTFT) | How fast you see the first part of a response. |
Time Per Output Token (TPOT) | How quickly the system sends each new part of the response. |
Many leading platforms, like BigQuery and Databricks, adjust resources based on query complexity. They use distributed systems to process large datasets and support real-time analytics. You can monitor query performance to spot slow queries and keep your system running smoothly.
When you compare Performance Benchmarks, always check how well a platform scales. This helps you pick a solution that grows with your business.
Comparative Performance Analysis
Benchmarking Methodologies
You need to know how experts measure log query performance. Different methods focus on different goals. When you look at query latency, you often see the p95 latency metric. This means you check how fast 95% of queries finish. Fast response times matter, especially if you want your queries to finish in less than two seconds. For throughput, you measure how much data the system can process in a set time. You also check how the system works under different loads.
You should measure efficiency, speed, and reliability for both latency and throughput.
You need to test under different conditions, like heavy traffic or many users.
You should use real-world usage patterns, not just simple tests.
You must test from your production region, not just on your local machine.
You can use persistent connections to see how the system handles ongoing work.
When you compare platforms, you also need to look at their architecture. Some systems use special file formats or metadata layers. These features can make queries faster or use less memory. For example, some platforms use data skipping or caching to speed up searches. Others need more management to get the best results.
Platform Comparison
You want to see how top platforms perform side by side. The table below shows how GreptimeDB, Loki, SigNoz, and ElasticSearch compare on key metrics. You can use these numbers to find the best fit for your needs.
Metric | GreptimeDB | Loki |
|---|---|---|
Query Speed (keyword searches) | - | |
Result Caching Speed Improvement | >500x | - |
CPU Utilization | 30%-35% | 33.75% |
Memory Consumption | 1.75GB-1.9GB | 1.4GB |
Compression Ratio | 3% of original | 8% |
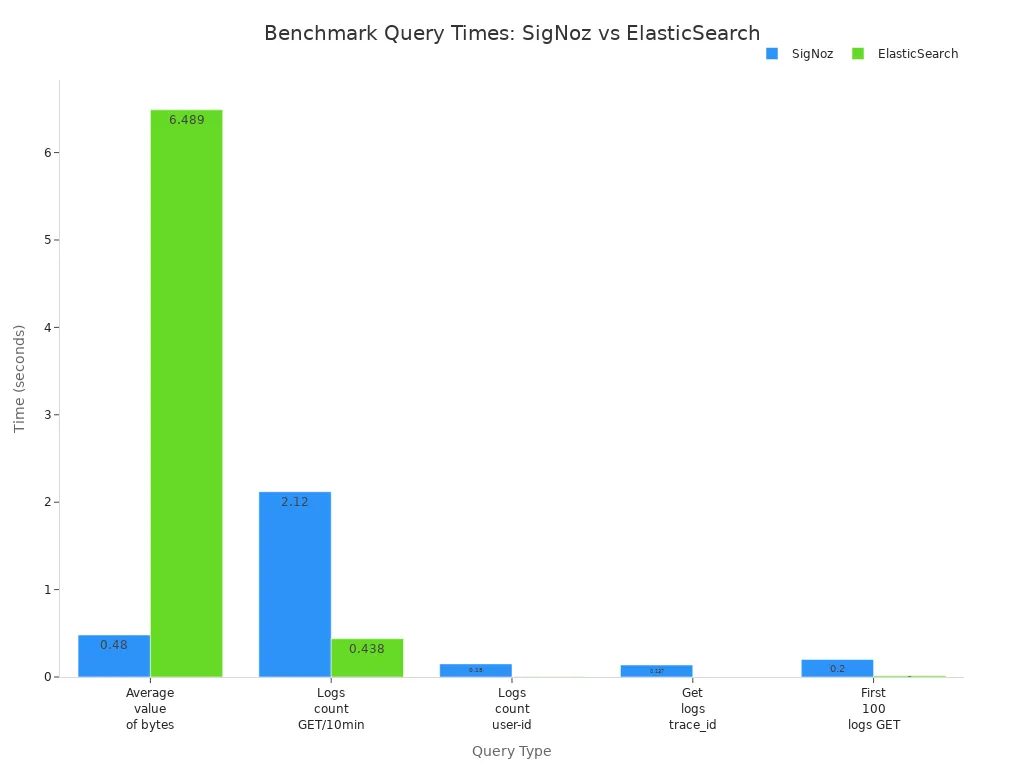
You can also compare query times for different types of searches:
Query Type | SigNoz (Time) | ElasticSearch (Time) | Loki (Time) |
|---|---|---|---|
Average value of the attribute bytes (aggregate query) | 0.48s | 6.489s | - |
Logs count with method GET per 10 min (low cardinality timeseries) | 2.12s | 0.438s | - |
Logs count for a user-identifier (high cardinality timeseries) | 0.15s | 0.002s | - |
Get logs corresponding to a trace_id | 0.137s | 0.001s | - |
Get first 100 logs with method GET | 0.20s | 0.014s | - |
You should also check how much space each platform uses:
Name | Space Used | Document Count |
|---|---|---|
SigNoz | 382mil | |
ElasticSearch | 388G | 376mil |
Loki | 142.2G | unknown |
You can see that GreptimeDB gives you very fast keyword searches and strong compression. ElasticSearch handles high-cardinality queries quickly. Loki uses less memory and disk space. SigNoz offers good performance for aggregate queries.
Interpreting Results
You need to know what these numbers mean for your business. If you want low-latency results, look for platforms that finish most queries in under two seconds. For high-concurrency needs, check how the system handles many users at once. You should see if the platform keeps latency low and does not show errors when you add more clusters.
When you add more clusters, queries per second go up. This means the system scales well.
Median latency drops as you add clusters. You get faster answers for most queries.
No errors during testing show the system is stable.
You should also think about how the platform fits into your setup. Look for easy integration, good monitoring tools, and support for teamwork. Make sure the platform can handle real-world workloads without lots of tuning.
If you need low-latency queries, you can choose a connection type that matches your use case. For example, HTTP works well for quick, parallel queries. WebSocket is better for many queries over one connection, but it takes longer to set up.
Connection Type | Performance Profile | Use Cases | Limitations |
|---|---|---|---|
HTTP | Optimized for minimal connection overhead | Low-latency query execution, parallel queries | No support for sessions or interactive transactions |
WebSocket | Higher initial overhead but faster for subsequent queries | Multiple queries over a maintained connection | Requires multiple round-trips to establish connection |
Tip: Always test with real data and real user patterns. This helps you pick the right platform based on your actual needs.
You should use Performance Benchmarks to guide your choice. Match the platform’s strengths to your main goals, like speed, scale, or cost.
You need to understand Performance Benchmarks to choose the right log query solution. Review your needs and compare platforms using current data.
Match features to your business size and goals.
Use benchmarks to spot gaps and improve efficiency.
Re-evaluate your solution often for best results.
Criterion | Description |
|---|---|
Contextual Alignment | Operate in similar business and user environments |
Data Accessibility | Use clear, comparable metrics and insights |
FAQ

What is the most important benchmark for log query performance?
Query latency matters most if you need fast answers. You should also check throughput and scalability for large data or many users.
How often should you review log query benchmarks?
You should review benchmarks every quarter. This helps you spot slowdowns and keep your system running well.
Can you improve log query performance without changing platforms?
Yes, you can:
Add more resources.
Use caching.
Optimize log structure.
See Also
Enhancing Performance of BI Ad-Hoc Queries Effectively
Addressing Performance Challenges in BI Ad-Hoc Queries
Achieving Quick Turns While Avoiding Stockouts—Key Metrics
