Retail Customer 360 Churn Prediction Data Warehouse Best Practices
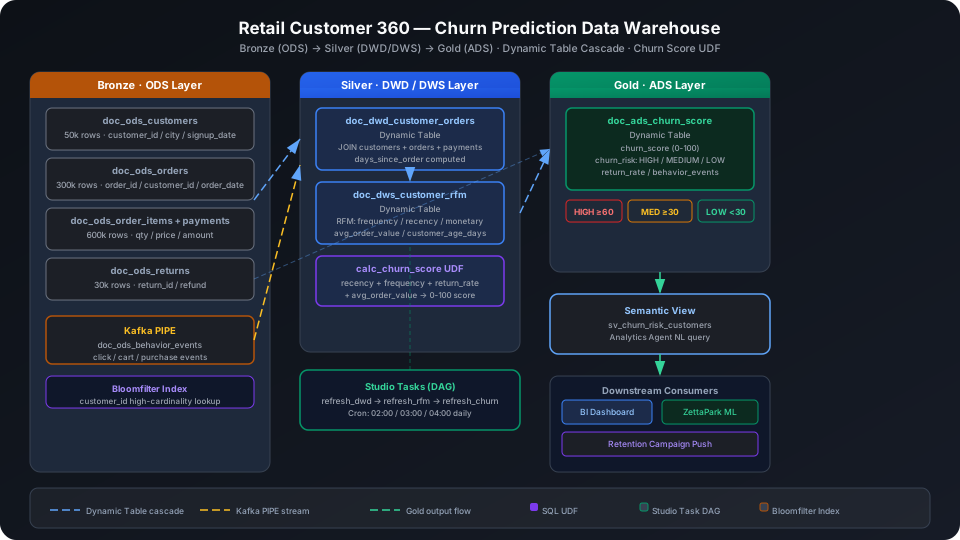
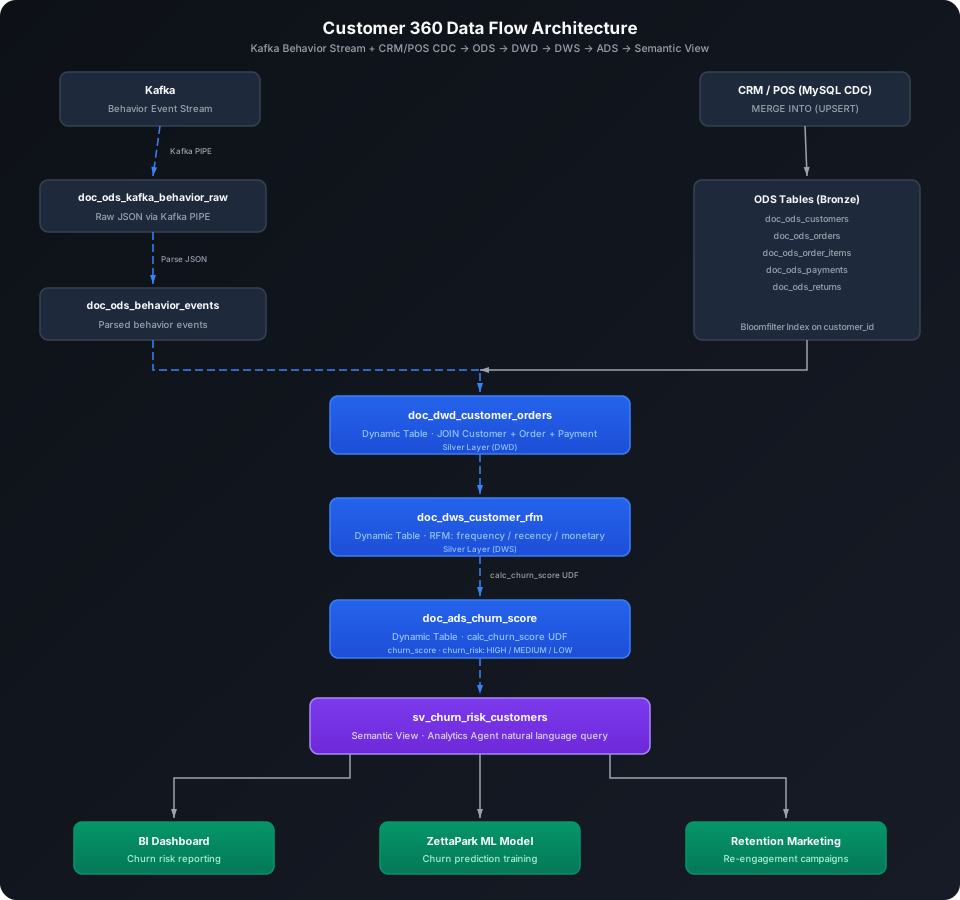
Integrate online e-commerce behavior, offline store transactions, and return records into a unified Customer 360 view, and use RFM metrics and churn scores to support targeted retention interventions. This guide uses a real retail dataset of 500K rows to walk through the complete Kafka PIPE → Bronze → Silver → Gold pipeline, covering MERGE INTO incremental merging, SQL UDF scoring, Semantic View natural language queries, and other key platform capabilities.
Overview
Typical challenges in retail customer churn prediction and Singdata Lakehouse's corresponding solutions:
Problem
Solution
Multi-channel data silos (e-commerce behavior, POS transactions, customer service tickets) are isolated and cannot be joined
Build a unified ODS in the Bronze layer; use MERGE INTO for multi-source incremental merging
Customer purchase records change in real time and RFM metrics need continuous updates
Dynamic Table declarative cascading refresh; the system automatically tracks upstream changes
Churn scoring logic is complex and used by multiple downstream tables
SQL UDF encapsulates the scoring formula; reusable in both Silver and Gold layers
Operations staff need to query high-risk customers using natural language
Semantic View integrated with Analytics Agent
High-cardinality customer_id point queries are slow
Bloomfilter Index for accelerated filtering
SQL Commands Used
Command / Function
Purpose
Notes
CREATE TABLE
Create Bronze layer ODS raw tables
Regular tables, used as upstream sources for Dynamic Tables
CREATE BLOOMFILTER INDEX
Create a Bloomfilter index on the customer_id column
Suitable for point query acceleration on high-cardinality columns
CREATE PIPE
Create a Kafka behavior event ingestion pipeline
Continuously ingests click, add-to-cart, and purchase events
MERGE INTO
Incrementally merge multi-source customer data
Supports UPSERT semantics — updates existing customers or inserts new ones
CREATE FUNCTION
Create the calc_churn_score scoring UDF
Encapsulates the recency + frequency + return_rate scoring formula
After extraction you get 12 CSV files: customers.csv (50K rows), orders.csv (300K rows), order_items.csv (600K rows), payments.csv (300K rows), returns.csv (30K rows), etc. This guide uses 50 customers, 100 orders, and 120 order items as the demo dataset.
ODS (Raw Data Layer): Multi-Channel Raw Data Ingestion
The ODS layer receives three categories of data sources: CRM/POS transaction data (batch or CDC sync), behavioral tracking events (Kafka streaming), and return records (scheduled batch).
Create Tables
-- Customer basic information table
CREATE TABLE IF NOT EXISTS best_practice_customer_360.doc_ods_customers (
customer_id BIGINT,
city STRING,
signup_date DATE
);
-- Orders table
CREATE TABLE IF NOT EXISTS best_practice_customer_360.doc_ods_orders (
order_id BIGINT,
customer_id BIGINT,
store_id BIGINT,
order_date DATE,
promotion_id BIGINT
);
-- Order items table
CREATE TABLE IF NOT EXISTS best_practice_customer_360.doc_ods_order_items (
order_item_id BIGINT,
order_id BIGINT,
product_id BIGINT,
qty INT,
price DOUBLE
);
-- Payments table
CREATE TABLE IF NOT EXISTS best_practice_customer_360.doc_ods_payments (
payment_id BIGINT,
order_id BIGINT,
amount DOUBLE
);
-- Returns table
CREATE TABLE IF NOT EXISTS best_practice_customer_360.doc_ods_returns (
return_id BIGINT,
order_item_id BIGINT,
refund DOUBLE
);
-- Kafka behavior event raw table (receives JSON strings)
CREATE TABLE IF NOT EXISTS best_practice_customer_360.doc_ods_kafka_behavior_raw (
value STRING,
ingest_time TIMESTAMP DEFAULT CURRENT_TIMESTAMP()
);
-- Behavior event parsed table
CREATE TABLE IF NOT EXISTS best_practice_customer_360.doc_ods_behavior_events (
event_id STRING,
customer_id BIGINT,
event_type STRING,
page STRING,
product_id BIGINT,
event_time TIMESTAMP,
ingest_time TIMESTAMP DEFAULT CURRENT_TIMESTAMP()
);
Create Bloomfilter Index
Both doc_ods_orders and doc_ods_behavior_events are frequently filtered by customer_id. This column's cardinality is in the range of the total customer count (high cardinality), making it a good candidate for a Bloomfilter Index.
CREATE BLOOMFILTER INDEX idx_bf_customer_id
ON TABLE doc_ods_orders (customer_id);
CREATE BLOOMFILTER INDEX idx_bf_event_customer
ON TABLE doc_ods_behavior_events (customer_id);
⚠️ Note: CREATE BLOOMFILTER INDEX requires the same Schema context as the target table. Run USE SCHEMA first or use the -s parameter; otherwise you see an "index and table must in the same schema" error.
Kafka Behavior Event Ingestion
Option 1: Real-time ingestion via Kafka PIPE (recommended for production)
In production, user click, add-to-cart, and purchase behavior events are reported by front-end tracking to Kafka. Ingest them continuously to the ODS layer via Kafka PIPE:
CREATE PIPE IF NOT EXISTS best_practice_customer_360.pipe_behavior_events
VIRTUAL_CLUSTER = 'DEFAULT'
BATCH_INTERVAL_IN_SECONDS = '60'
AS
COPY INTO best_practice_customer_360.doc_ods_kafka_behavior_raw
FROM (
SELECT CAST(value AS STRING) AS value
FROM READ_KAFKA(
'<kafka-broker>:9092', -- replace with actual broker address
'retail_behavior_events', -- topic name
'',
'cz_c360_consumer', -- consumer group
'','','','',
'raw','raw',
0,
map()
)
);
Python producer example for sending behavior events to the Kafka topic:
💡 Tip: In a PIPE DDL, READ_KAFKA positional parameters 5–8 (start/end offsets, timestamps) must be left empty — they are managed automatically by the PIPE runtime.
Option 2: INSERT simulation (when no Kafka environment is available)
If Kafka is not configured, you can save data as local CSV files, upload them to a User Volume via cz-cli, then import with COPY INTO (recommended):
💡 Tip: The examples below use cz-cli (the Singdata Lakehouse command-line tool). If cz-cli is not installed, see the cz-cli Installation and Usage Guide. If you prefer not to use the command line, you can run the SQL in Singdata Studio → Development → SQL Editor and configure / trigger scheduling tasks on the Studio → Tasks page.
Import from a local CSV file (recommended)
-- Step 1: Upload the local CSV file to User Volume via SQL PUT
PUT '/path/to/behavior_events_data.csv' TO USER VOLUME FILE 'behavior_events_data.csv';
-- Step 2: COPY INTO the table from User Volume
COPY INTO best_practice_customer_360.doc_ods_behavior_events
FROM USER VOLUME
USING csv
OPTIONS('header'='true', 'sep'=',', 'nullValue'='')
FILES ('behavior_events_data.csv');
You can also insert a small batch of test data inline (no CSV file required):
INSERT INTO best_practice_customer_360.doc_ods_behavior_events
(event_id, customer_id, event_type, page, product_id, event_time)
VALUES
('E001',1,'view','product',472,CAST('2025-11-01 10:00:00' AS TIMESTAMP)),
('E002',1,'cart','product',472,CAST('2025-11-01 10:05:00' AS TIMESTAMP)),
('E003',1,'purchase','checkout',472,CAST('2025-11-01 10:10:00' AS TIMESTAMP)),
('E004',2,'view','product',1666,CAST('2025-11-02 09:00:00' AS TIMESTAMP)),
('E005',3,'purchase','checkout',9246,CAST('2025-11-03 14:30:00' AS TIMESTAMP)),
('E006',2,'view','product',1666,CAST('2025-11-03 11:00:00' AS TIMESTAMP)),
('E007',2,'cart','product',1666,CAST('2025-11-03 11:10:00' AS TIMESTAMP)),
('E008',4,'view','product',321,CAST('2025-11-04 08:30:00' AS TIMESTAMP)),
('E009',5,'view','product',889,CAST('2025-11-04 09:00:00' AS TIMESTAMP)),
('E010',5,'cart','product',889,CAST('2025-11-04 09:15:00' AS TIMESTAMP)),
('E011',6,'purchase','checkout',512,CAST('2025-11-05 14:00:00' AS TIMESTAMP)),
('E012',7,'view','product',734,CAST('2025-11-06 10:30:00' AS TIMESTAMP)),
('E013',8,'view','product',201,CAST('2025-11-06 13:00:00' AS TIMESTAMP)),
('E014',8,'cart','product',201,CAST('2025-11-06 13:20:00' AS TIMESTAMP)),
('E015',9,'purchase','checkout',3301,CAST('2025-11-07 16:00:00' AS TIMESTAMP)),
('E016',10,'view','product',4412,CAST('2025-11-08 09:45:00' AS TIMESTAMP)),
('E017',10,'purchase','checkout',4412,CAST('2025-11-08 10:00:00' AS TIMESTAMP)),
('E018',11,'view','home',0,CAST('2025-11-09 08:00:00' AS TIMESTAMP)),
('E019',12,'view','product',671,CAST('2025-11-10 11:00:00' AS TIMESTAMP)),
('E020',13,'view','product',882,CAST('2025-11-10 14:00:00' AS TIMESTAMP)),
('E021',13,'cart','product',882,CAST('2025-11-10 14:30:00' AS TIMESTAMP)),
('E022',14,'purchase','checkout',993,CAST('2025-11-11 10:00:00' AS TIMESTAMP)),
('E023',15,'view','product',1104,CAST('2025-11-12 09:00:00' AS TIMESTAMP)),
('E024',16,'view','product',2215,CAST('2025-11-13 15:00:00' AS TIMESTAMP)),
('E025',17,'purchase','checkout',3326,CAST('2025-11-14 11:30:00' AS TIMESTAMP)),
('E026',18,'view','product',4437,CAST('2025-11-15 13:00:00' AS TIMESTAMP)),
('E027',19,'cart','product',5548,CAST('2025-11-16 10:00:00' AS TIMESTAMP)),
('E028',20,'view','product',6659,CAST('2025-11-17 09:30:00' AS TIMESTAMP)),
('E029',21,'purchase','checkout',7770,CAST('2025-11-18 14:00:00' AS TIMESTAMP)),
('E030',22,'view','product',8881,CAST('2025-11-19 11:00:00' AS TIMESTAMP)),
('E031',23,'view','product',9992,CAST('2025-11-20 10:30:00' AS TIMESTAMP)),
('E032',24,'cart','product',1113,CAST('2025-11-21 16:00:00' AS TIMESTAMP)),
('E033',25,'purchase','checkout',2224,CAST('2025-11-22 09:00:00' AS TIMESTAMP)),
('E034',26,'view','product',3335,CAST('2025-11-23 14:30:00' AS TIMESTAMP)),
('E035',27,'view','product',4446,CAST('2025-11-24 11:00:00' AS TIMESTAMP)),
('E036',28,'cart','product',5557,CAST('2025-11-25 10:00:00' AS TIMESTAMP)),
('E037',29,'purchase','checkout',6668,CAST('2025-11-26 15:00:00' AS TIMESTAMP)),
('E038',30,'view','product',7779,CAST('2025-11-27 09:00:00' AS TIMESTAMP)),
('E039',31,'view','product',8880,CAST('2025-11-28 13:00:00' AS TIMESTAMP)),
('E040',32,'cart','product',9991,CAST('2025-11-29 11:30:00' AS TIMESTAMP)),
('E041',33,'purchase','checkout',1102,CAST('2025-11-30 10:00:00' AS TIMESTAMP)),
('E042',34,'view','product',2213,CAST('2025-12-01 09:30:00' AS TIMESTAMP)),
('E043',35,'view','product',3324,CAST('2025-12-02 14:00:00' AS TIMESTAMP)),
('E044',36,'cart','product',4435,CAST('2025-12-03 11:00:00' AS TIMESTAMP)),
('E045',37,'purchase','checkout',5546,CAST('2025-12-04 10:30:00' AS TIMESTAMP)),
('E046',38,'view','product',6657,CAST('2025-12-05 15:00:00' AS TIMESTAMP)),
('E047',39,'view','product',7768,CAST('2025-12-06 09:00:00' AS TIMESTAMP)),
('E048',40,'cart','product',8879,CAST('2025-12-07 13:00:00' AS TIMESTAMP)),
('E049',41,'purchase','checkout',9980,CAST('2025-12-08 11:00:00' AS TIMESTAMP)),
('E050',43,'purchase','checkout',2986,CAST('2025-12-13 14:00:00' AS TIMESTAMP));
Verify ODS layer data volumes:
SELECT 'customers' AS tbl, COUNT(*) AS cnt FROM best_practice_customer_360.doc_ods_customers
UNION ALL
SELECT 'orders', COUNT(*) FROM best_practice_customer_360.doc_ods_orders
UNION ALL
SELECT 'order_items', COUNT(*) FROM best_practice_customer_360.doc_ods_order_items
UNION ALL
SELECT 'payments', COUNT(*) FROM best_practice_customer_360.doc_ods_payments
UNION ALL
SELECT 'returns', COUNT(*) FROM best_practice_customer_360.doc_ods_returns
UNION ALL
SELECT 'behavior', COUNT(*) FROM best_practice_customer_360.doc_ods_behavior_events;
MERGE INTO: Incremental Multi-Source Customer Data Merging
When the CRM system pushes customer updates, use MERGE INTO to implement UPSERT — update city and signup date for existing customers, insert new customers directly:
MERGE INTO best_practice_customer_360.doc_ods_customers AS tgt
USING (
SELECT 51 AS customer_id, 'Chennai' AS city, CAST('2024-01-15' AS DATE) AS signup_date
UNION ALL
SELECT 1, 'Mumbai', CAST('2021-02-16' AS DATE)
) AS src ON tgt.customer_id = src.customer_id
WHEN MATCHED THEN
UPDATE SET city = src.city, signup_date = src.signup_date
WHEN NOT MATCHED THEN
INSERT (customer_id, city, signup_date)
VALUES (src.customer_id, src.city, src.signup_date);
After execution the customers table grows from 50 to 51 rows (customer_id=51 is a new customer), and customer_id=1's city information is updated to the latest value.
💡 Tip: In production, the USING clause is typically replaced with SELECT * FROM staging_table, where the staging table holds the latest incremental data pushed by the upstream system.
Churn Score UDF
Encapsulate churn prediction scoring logic into a SQL UDF, reusable in both Silver and Gold layers.
Scoring rules:
Recency contribution: no purchase in over 180 days: +40; over 90 days: +25; over 60 days: +15; otherwise: +5
Frequency contribution: only 1 order: +20; 3 or fewer orders: +10; more than 3 orders: +0
Order value contribution: average order value < 1000: +10
Final score is capped in the 0–100 range
CREATE OR REPLACE FUNCTION best_practice_customer_360.calc_churn_score(
days_since_last_order INT,
total_orders INT,
avg_order_value DOUBLE,
return_rate DOUBLE
)
RETURNS DOUBLE
AS LEAST(100.0, GREATEST(0.0,
CASE WHEN days_since_last_order > 180 THEN 40.0
WHEN days_since_last_order > 90 THEN 25.0
WHEN days_since_last_order > 60 THEN 15.0
ELSE 5.0
END
+ CASE WHEN total_orders <= 1 THEN 20.0
WHEN total_orders <= 3 THEN 10.0
ELSE 0.0
END
+ CASE WHEN return_rate > 0.3 THEN 20.0
WHEN return_rate > 0.1 THEN 10.0
ELSE 0.0
END
+ CASE WHEN avg_order_value < 1000 THEN 10.0
ELSE 0.0
END
));
Verify scores for three typical customer types:
SELECT
best_practice_customer_360.calc_churn_score(200, 1, 800.0, 0.35) AS score_high_risk,
best_practice_customer_360.calc_churn_score(45, 8, 12000.0, 0.02) AS score_low_risk,
best_practice_customer_360.calc_churn_score(100, 3, 2000.0, 0.12) AS score_medium_risk;
High-risk customer (90): 200 days without purchase (+40) + only 1 order (+20) + return rate 35% (+20) + low order value (+10)
Low-risk customer (5): purchase within 45 days (+5), 8 orders with high average order value — almost no churn signals
Medium risk (45): 100 days without purchase (+25) + 3 or fewer orders (+10) + 10% return rate (+10)
Silver Layer Dynamic Table: Order Wide Table and RFM Metrics
DWD (Detail Data Layer): Customer Order Wide Table
The DWD layer JOINs the customer dimension, order facts, and payment amounts into a flat table and calculates days since last order as of today:
CREATE DYNAMIC TABLE IF NOT EXISTS best_practice_customer_360.doc_dwd_customer_orders
AS
SELECT
c.customer_id,
c.city,
c.signup_date,
o.order_id,
o.order_date,
o.store_id,
o.promotion_id,
p.amount AS payment_amount,
DATEDIFF(CAST('2026-06-06' AS DATE), o.order_date) AS days_since_order
FROM best_practice_customer_360.doc_ods_customers c
JOIN best_practice_customer_360.doc_ods_orders o ON c.customer_id = o.customer_id
LEFT JOIN best_practice_customer_360.doc_ods_payments p ON o.order_id = p.order_id;
⚠️ Note: Dynamic Table DDL does not include REFRESH INTERVAL. Refresh scheduling is managed through Studio Tasks — which lets you attach data quality checks and alert rules to the same task.
Trigger the initial refresh manually:
REFRESH DYNAMIC TABLE best_practice_customer_360.doc_dwd_customer_orders;
SELECT COUNT(*) AS silver_count FROM best_practice_customer_360.doc_dwd_customer_orders;
silver_count
------------
100
View a sample of the order wide table:
SELECT customer_id, city, order_id, order_date, payment_amount, days_since_order
FROM best_practice_customer_360.doc_dwd_customer_orders
ORDER BY customer_id
LIMIT 8;
The DWS layer aggregates at customer_id granularity to compute the three RFM metrics and customer account age:
CREATE DYNAMIC TABLE IF NOT EXISTS best_practice_customer_360.doc_dws_customer_rfm
AS
SELECT
o.customer_id,
c.city,
c.signup_date,
COUNT(DISTINCT o.order_id) AS frequency,
MIN(o.days_since_order) AS recency_days,
ROUND(SUM(o.payment_amount), 2) AS monetary,
ROUND(AVG(o.payment_amount), 2) AS avg_order_value,
DATEDIFF(CAST('2026-06-06' AS DATE), c.signup_date) AS customer_age_days
FROM best_practice_customer_360.doc_dwd_customer_orders o
JOIN best_practice_customer_360.doc_ods_customers c ON o.customer_id = c.customer_id
GROUP BY o.customer_id, c.city, c.signup_date;
Trigger manual refresh and view high-value customers:
REFRESH DYNAMIC TABLE best_practice_customer_360.doc_dws_customer_rfm;
SELECT customer_id, city, frequency, recency_days, monetary, avg_order_value, customer_age_days
FROM best_practice_customer_360.doc_dws_customer_rfm
ORDER BY monetary DESC
LIMIT 8;
customer_id=1 (Mumbai) total spend 35304, but recency_days=1962 (over 5 years without purchase). High historical value combined with long-term silence is the classic "historically high value, currently high churn risk" customer profile — a priority for win-back campaigns.
customer_id=24 (Bangalore) recency_days=1030, relatively newer, with cumulative spend of 30731 — a high-potential customer segment in Bangalore.
Gold Layer Dynamic Table: Churn Score and Risk Tiers
ADS (Application Data Layer): Churn Score Wide Table
The ADS layer aggregates RFM metrics, return statistics, and behavior events, calls the calc_churn_score UDF to score, and outputs three risk levels:
CREATE DYNAMIC TABLE IF NOT EXISTS best_practice_customer_360.doc_ads_churn_score
AS
WITH return_stats AS (
SELECT
o.customer_id,
COUNT(DISTINCT r.return_id) AS return_count,
COUNT(DISTINCT oi.order_item_id) AS item_count
FROM best_practice_customer_360.doc_ods_order_items oi
JOIN best_practice_customer_360.doc_ods_orders o ON oi.order_id = o.order_id
LEFT JOIN best_practice_customer_360.doc_ods_returns r ON oi.order_item_id = r.order_item_id
GROUP BY o.customer_id
),
behavior_stats AS (
SELECT
customer_id,
COUNT(*) AS total_events,
COUNT(CASE WHEN event_type = 'purchase' THEN 1 END) AS purchase_events
FROM best_practice_customer_360.doc_ods_behavior_events
GROUP BY customer_id
)
SELECT
rfm.customer_id,
rfm.city,
rfm.frequency,
rfm.recency_days,
rfm.monetary,
rfm.avg_order_value,
COALESCE(rs.return_count, 0) AS return_count,
COALESCE(rs.item_count, 0) AS item_count,
CASE WHEN rs.item_count > 0
THEN ROUND(CAST(rs.return_count AS DOUBLE) / rs.item_count, 4)
ELSE 0.0 END AS return_rate,
COALESCE(bs.total_events, 0) AS total_events,
COALESCE(bs.purchase_events, 0) AS purchase_events,
ROUND(best_practice_customer_360.calc_churn_score(
CAST(rfm.recency_days AS INT),
CAST(rfm.frequency AS INT),
rfm.avg_order_value,
CASE WHEN rs.item_count > 0
THEN CAST(rs.return_count AS DOUBLE) / rs.item_count
ELSE 0.0 END
), 2) AS churn_score,
CASE
WHEN best_practice_customer_360.calc_churn_score(
CAST(rfm.recency_days AS INT), CAST(rfm.frequency AS INT),
rfm.avg_order_value,
CASE WHEN rs.item_count > 0
THEN CAST(rs.return_count AS DOUBLE) / rs.item_count ELSE 0.0 END
) >= 60 THEN 'HIGH'
WHEN best_practice_customer_360.calc_churn_score(
CAST(rfm.recency_days AS INT), CAST(rfm.frequency AS INT),
rfm.avg_order_value,
CASE WHEN rs.item_count > 0
THEN CAST(rs.return_count AS DOUBLE) / rs.item_count ELSE 0.0 END
) >= 30 THEN 'MEDIUM'
ELSE 'LOW'
END AS churn_risk
FROM best_practice_customer_360.doc_dws_customer_rfm rfm
LEFT JOIN return_stats rs ON rfm.customer_id = rs.customer_id
LEFT JOIN behavior_stats bs ON rfm.customer_id = bs.customer_id;
⚠️ Note: The second parameter of calc_churn_score UDF, total_orders, is typed as INT, while frequency in the Dynamic Table (from COUNT DISTINCT) is BIGINT. An explicit CAST(rfm.frequency AS INT) is required; otherwise the SQL compiler raises a type mismatch error.
Trigger manual refresh and view high churn risk customers:
REFRESH DYNAMIC TABLE best_practice_customer_360.doc_ads_churn_score;
SELECT customer_id, city, frequency, recency_days, monetary,
avg_order_value, return_rate, churn_score, churn_risk
FROM best_practice_customer_360.doc_ads_churn_score
ORDER BY churn_score DESC, recency_days DESC
LIMIT 10;
All HIGH-risk customers have churn_score=70. Their common profile is: no purchase for 180+ days (+40) + purchase count ≤ 3 (+10) + return rate > 10% (+10) + no low order value deduction (avg > 1000). Total: 70.
customer_id=22 has spent 22159 but 1908 days without purchase (about 5 years) — a dormant high-value customer suitable for reactivation marketing.
customer_id=4 (Mumbai) return_rate=0.33 means 1 return in 3 purchases. Combined with the long-term no-purchase signal, churn probability is high.
View risk level distribution:
SELECT churn_risk, COUNT(*) AS customer_count
FROM best_practice_customer_360.doc_ads_churn_score
GROUP BY churn_risk
ORDER BY churn_risk;
churn_risk | customer_count
-----------+---------------
HIGH | 20
MEDIUM | 30
View average churn score by city:
SELECT city,
COUNT(*) AS customer_count,
ROUND(AVG(churn_score), 1) AS avg_churn_score,
COUNT(CASE WHEN churn_risk='HIGH' THEN 1 END) AS high_risk_count
FROM best_practice_customer_360.doc_ads_churn_score
GROUP BY city
ORDER BY avg_churn_score DESC;
Beyond order data, behavioral tracking data can reveal "browse-but-not-purchase" latent churn signals:
SELECT
b.customer_id,
c.city,
COUNT(CASE WHEN b.event_type = 'view' THEN 1 END) AS views,
COUNT(CASE WHEN b.event_type = 'cart' THEN 1 END) AS carts,
COUNT(CASE WHEN b.event_type = 'purchase' THEN 1 END) AS purchases,
ROUND(COUNT(CASE WHEN b.event_type = 'purchase' THEN 1 END) * 100.0 / COUNT(*), 1)
AS purchase_rate_pct
FROM best_practice_customer_360.doc_ods_behavior_events b
JOIN best_practice_customer_360.doc_ods_customers c ON b.customer_id = c.customer_id
GROUP BY b.customer_id, c.city
HAVING COUNT(*) > 1
ORDER BY purchase_rate_pct DESC;
customer_id=5 and customer_id=8 both show "added to cart but did not pay" abandonment behavior. Combined with their order churn scores, cart recovery push notifications can be triggered.
Semantic View: Analytics Agent Natural Language Queries
Create a Semantic View on the Gold layer churn score table, providing semantic field names for Analytics Agent to parse natural language queries:
CREATE OR REPLACE VIEW best_practice_customer_360.sv_churn_risk_customers AS
SELECT
customer_id,
city,
frequency AS purchase_frequency,
recency_days AS days_since_last_purchase,
monetary AS total_spend,
avg_order_value,
return_rate,
total_events AS behavior_events,
purchase_events AS online_purchases,
churn_score,
churn_risk AS risk_level
FROM best_practice_customer_360.doc_ads_churn_score;
Example query: using natural language "find high-churn-risk customers in Bangalore who spent over 10,000" — Analytics Agent would translate this to:
SELECT customer_id, city, purchase_frequency, days_since_last_purchase,
total_spend, churn_score, risk_level
FROM best_practice_customer_360.sv_churn_risk_customers
WHERE city = 'Bangalore'
AND risk_level = 'HIGH'
AND total_spend > 10000
ORDER BY churn_score DESC;
02:00 refresh_dwd_customer_orders (DWD layer · customer order wide table)
↓ after completion
03:00 refresh_dws_customer_rfm (DWS layer · RFM metrics)
↓ after completion
04:00 refresh_ads_churn_score (ADS layer · churn scores)
💡 Tip: Studio Tasks support attaching data quality rules and alerts to the same task. For example, after refresh_ads_churn_score completes, you can configure a rule to "send an alert when the proportion of HIGH-risk customers exceeds 50%" for integrated data quality and business monitoring.
Data Warehouse Object Summary
After the full build, objects in the best_practice_customer_360 schema:
Dynamic Table does not set REFRESH INTERVAL: The DDL does not include REFRESH INTERVAL. The Studio Tasks (refresh_dwd_customer_orders → refresh_dws_customer_rfm → refresh_ads_churn_score) schedule in DAG order. This lets you attach quality checks and alert rules to the same task, not just the refresh.
calc_churn_score UDF type matching: The second parameter total_orders is declared as INT, but COUNT DISTINCT in a Dynamic Table returns BIGINT. An explicit CAST(frequency AS INT) is required before the call; otherwise the SQL compiler raises a type mismatch error.
MERGE INTO write mode and Dynamic Table incremental refresh: When the ODS layer uses MERGE INTO for append writes, Dynamic Tables can track new and updated rows for normal incremental refresh. Using INSERT OVERWRITE for full replacement causes Dynamic Tables to fall back to a full recompute. Always use INSERT INTO or MERGE INTO to maintain append mode.
Bloomfilter Index limitation on existing data: CREATE BLOOMFILTER INDEX only automatically applies to data written after the index is created and provides no filtering acceleration for existing data. The BLOOMFILTER type does not support the BUILD INDEX command — covering existing data requires rebuilding the table.
Semantic View field naming: Field names in sv_churn_risk_customers should use business language as much as possible (e.g., days_since_last_purchase rather than recency_days) to help Analytics Agent more accurately parse intent from natural language.
Tuning the churn_score formula: The current weights (recency highest at 40 points) are suited to e-commerce scenarios where recent activity is the core signal. For high average order value B2B scenarios, consider reducing recency weight and increasing monetary weight. For subscription scenarios, replace recency with "consecutive months without renewal".