Billing Anomaly Alert Configuration Guide

Singdata Lakehouse Billing Anomaly Alert Configuration Guide

Overview

This guide helps you quickly configure a billing anomaly monitoring system to trigger automatic alerts when costs surge unexpectedly, ensuring cost safety.

Prerequisites

  • Have the instance_admin role permission to query billing data from the sys.information_schema.instance_usage view.
  • Have the instance_sre role permission to use the "Data Quality" and "Monitoring & Alerting" features.
  • Have access to a compute cluster in a workspace (for executing quality rule query SQL) and metadata query (read metadata) permission on a table or view (for configuring quality rules).

Data Used

The fields and content of the sys.information_schema.instance_usage view are described in the appendix at the end of this document.

Configuration Steps

Step 1: Create a Data Quality Rule

1. Enter the Data Quality Management module

2. Click Create Quality Rule
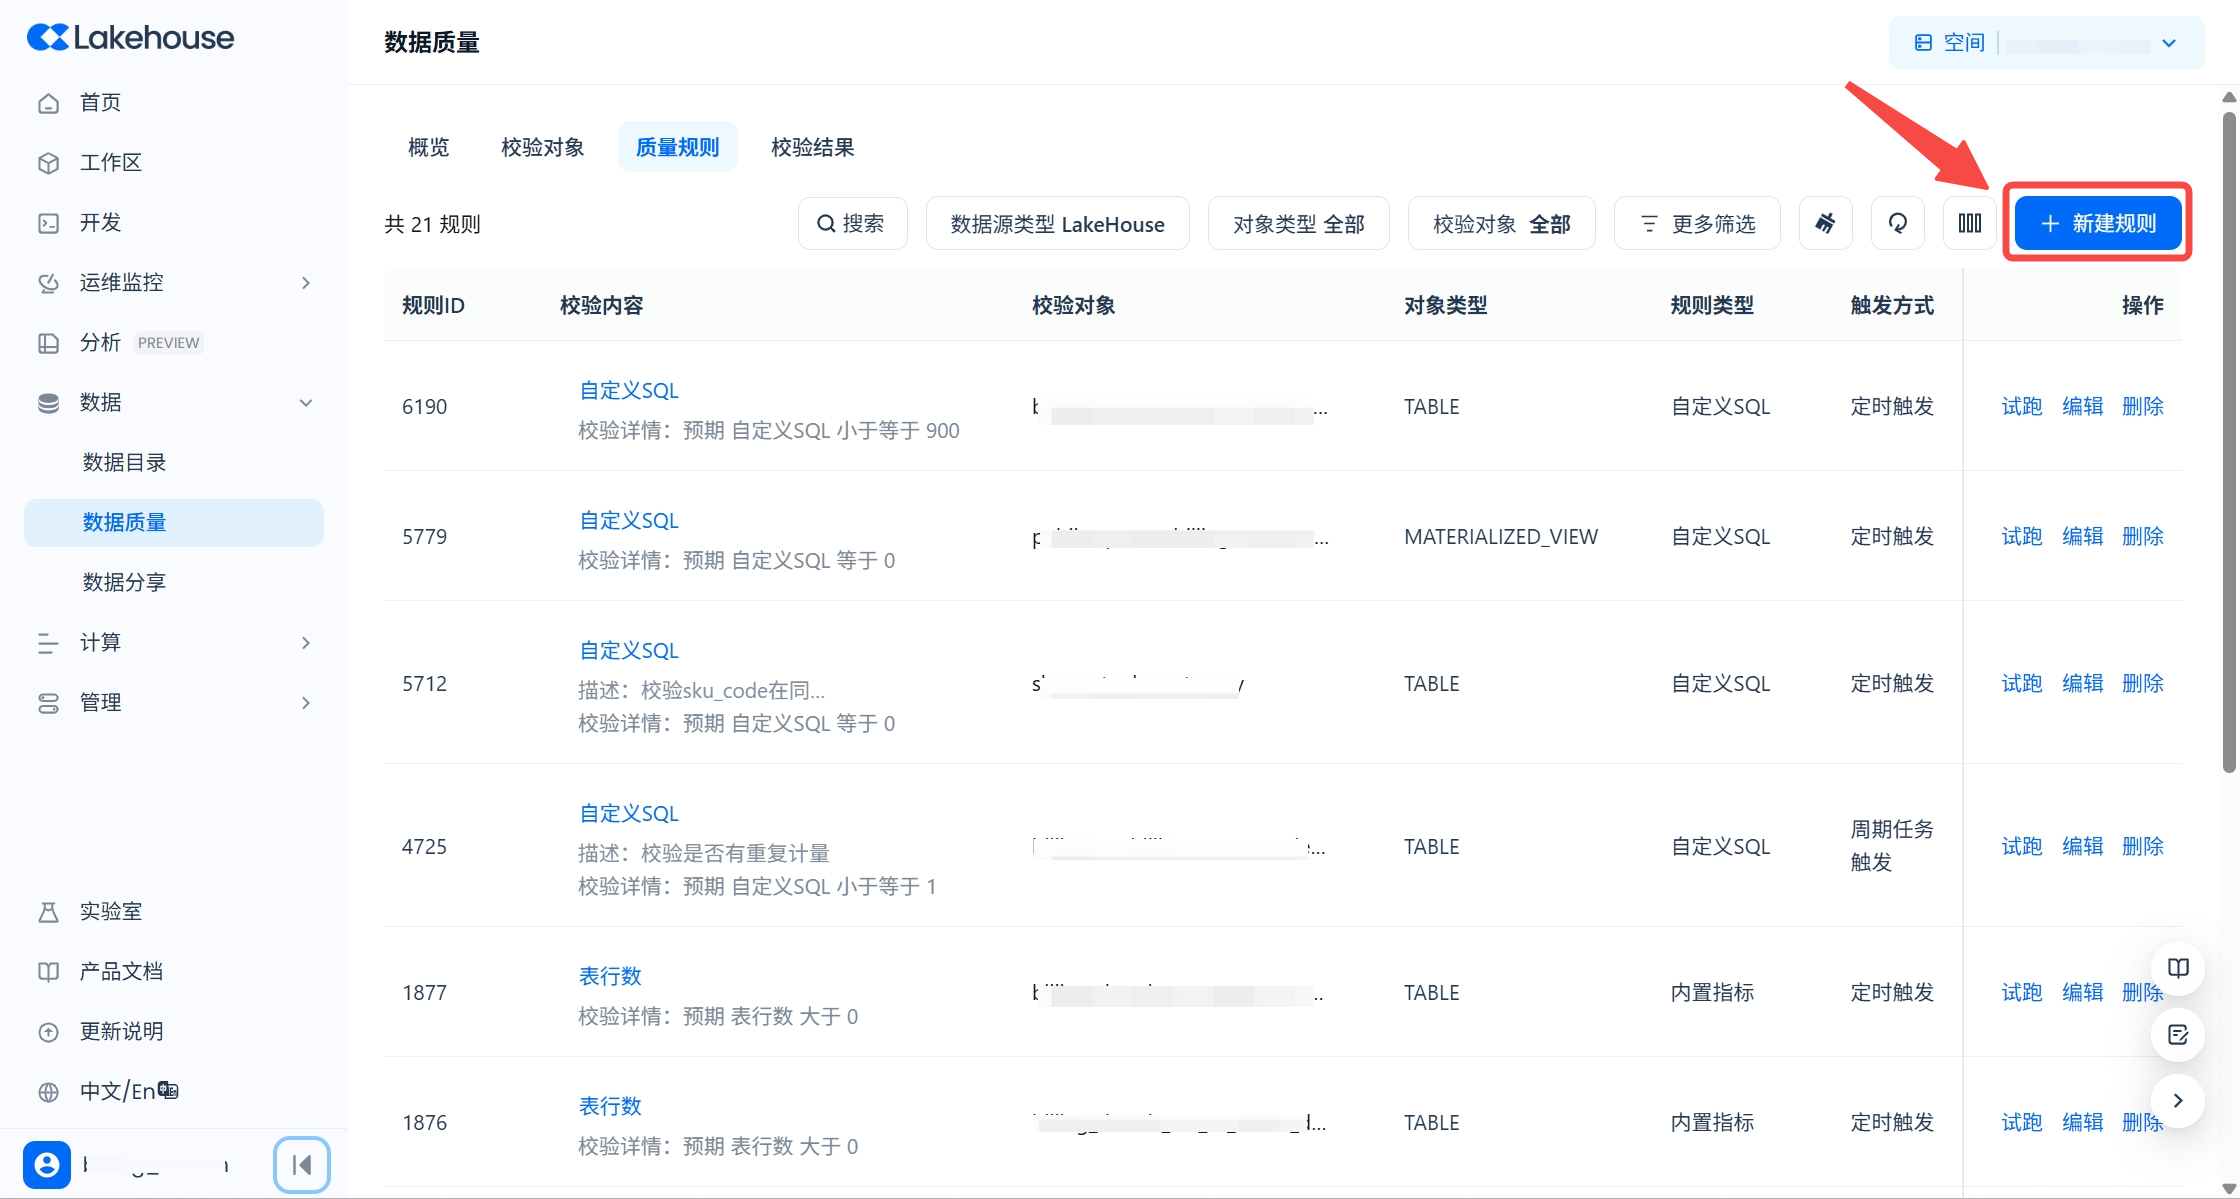
3. Fill in basic information:
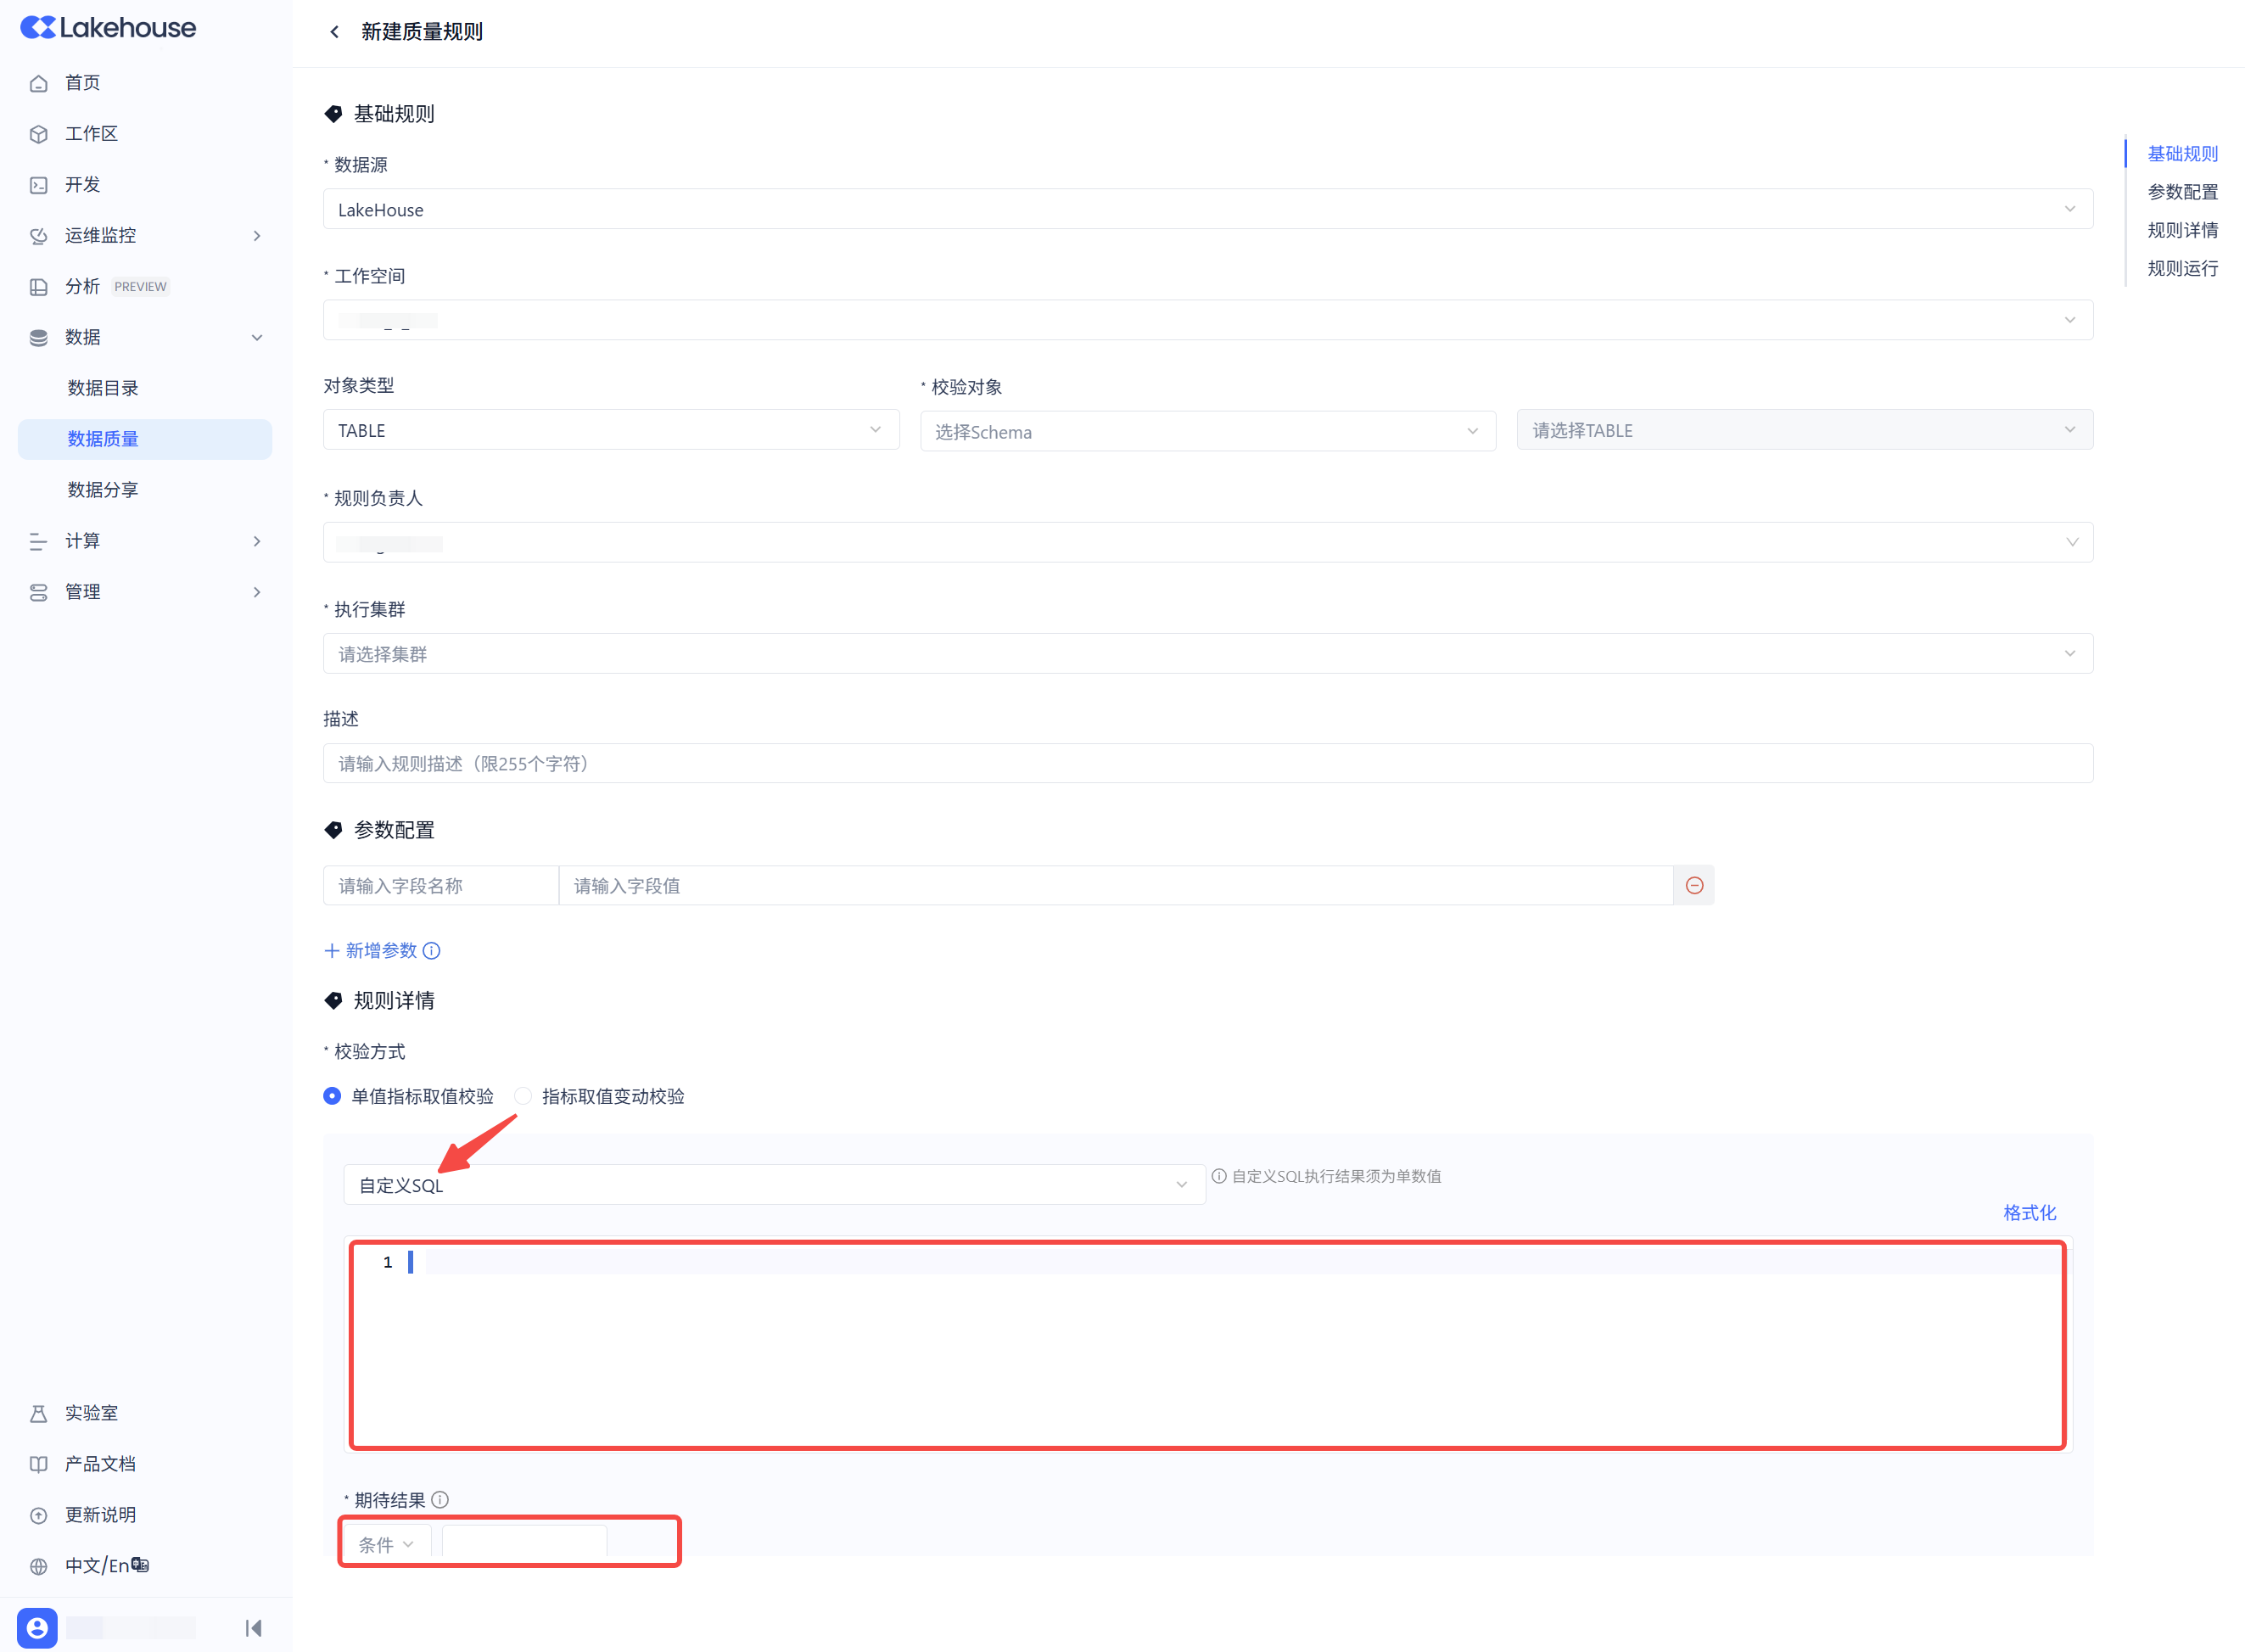
In this case, focus on the following three options:

  1. Verification Method: Select "Custom SQL";
  2. Based on the recommended rules in this document, paste the SQL directly into the text box;
  3. Under "Expected Result", configure the corresponding condition and value based on the selected rule.

For other field configurations, refer to the complete Data Quality configuration documentation: Data Quality

Step 2: Configure Monitoring & Alerting

1. Enter the Monitoring & Alerting module and click Create Rule
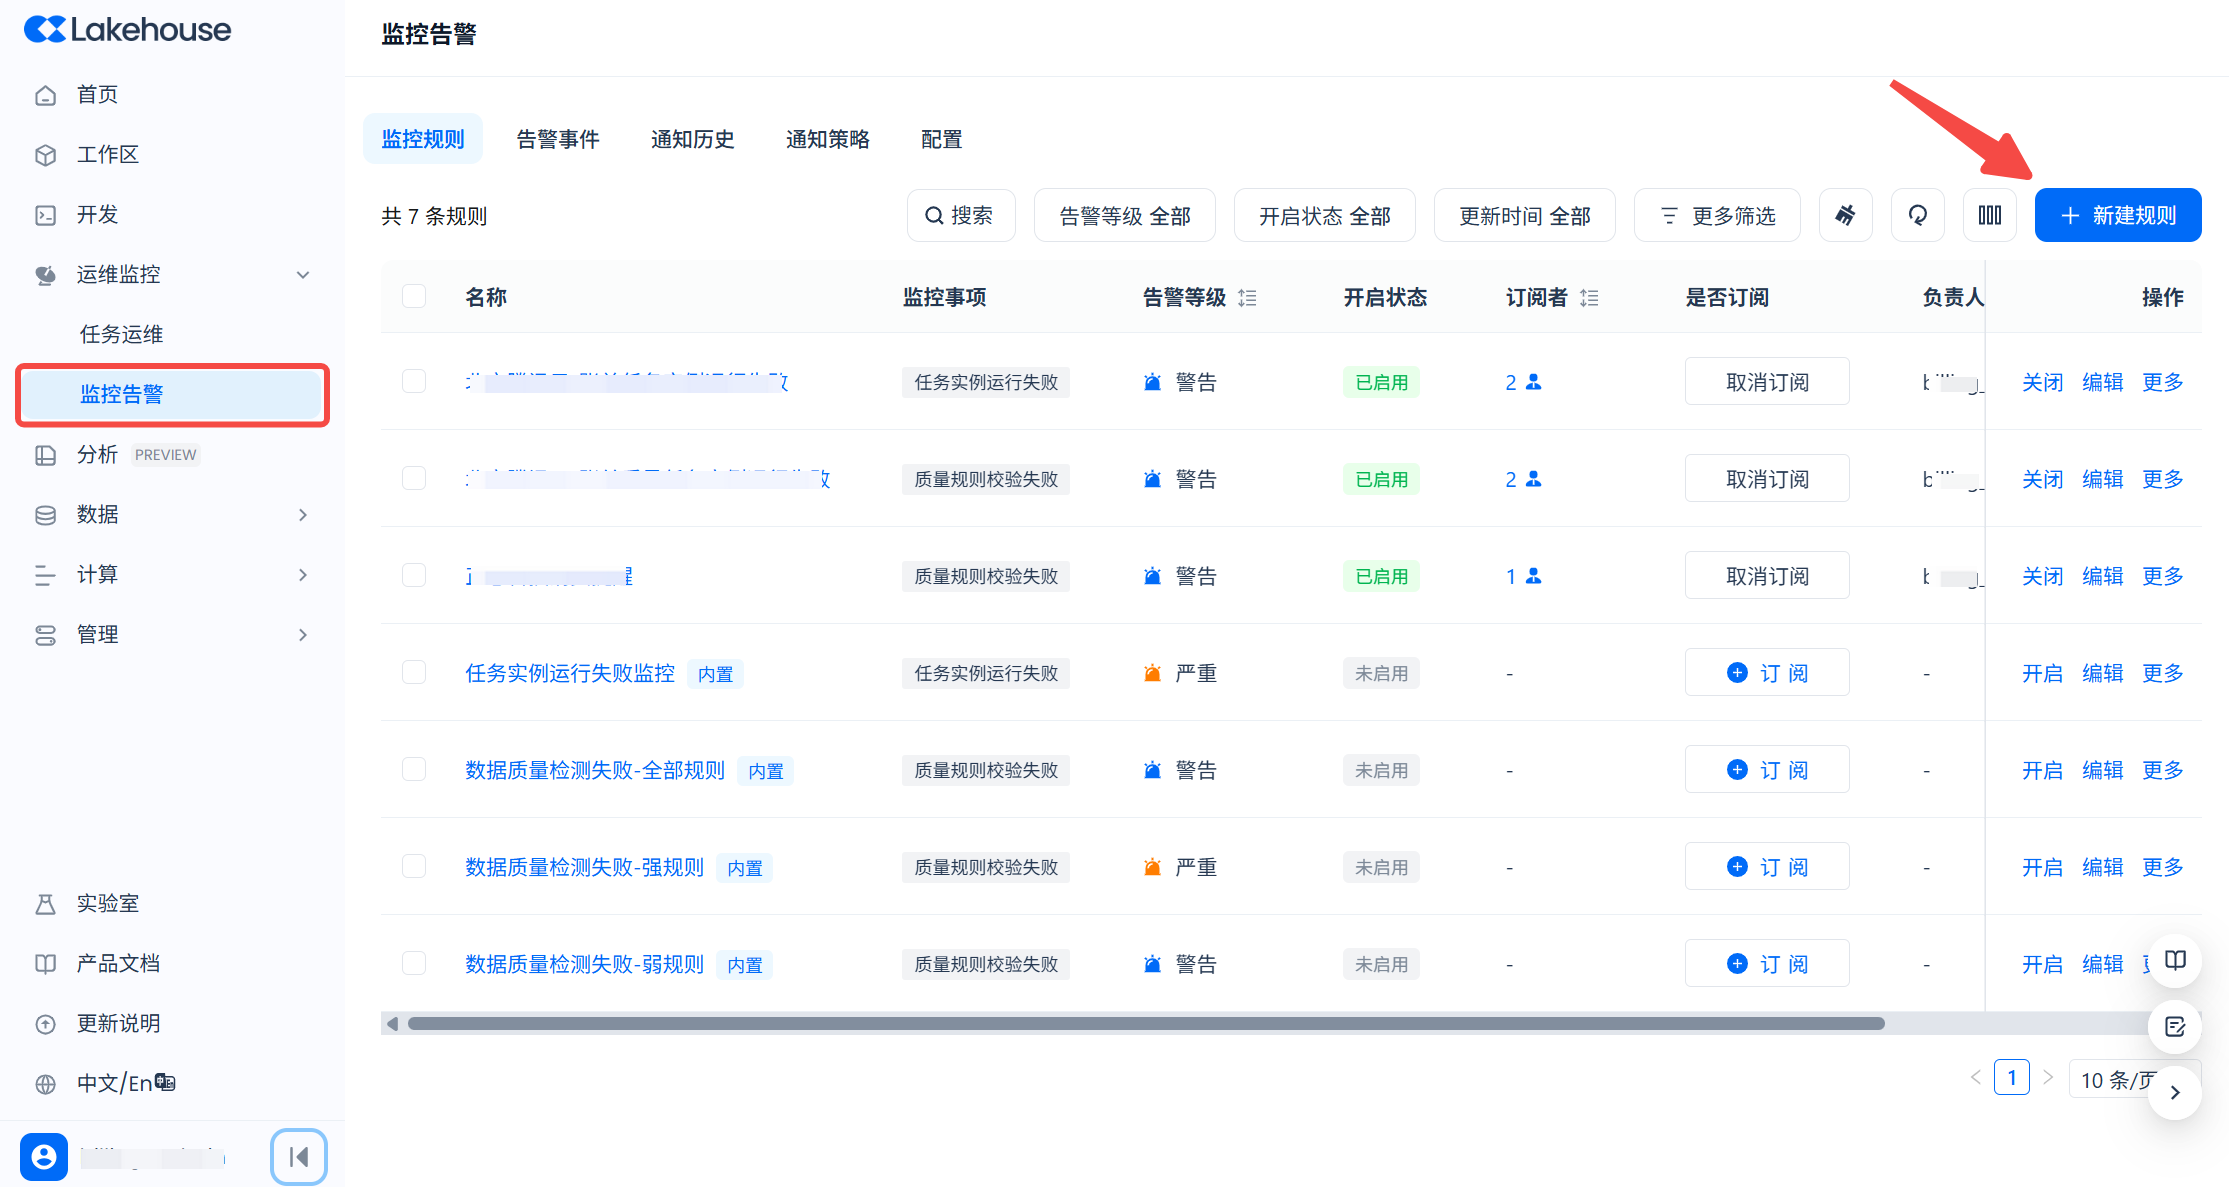
2. Configure the alert rule

In this case, focus on the following three options:

  1. Monitoring Item: Select the Data Quality Monitoring Failed alert type, and add filter conditions to effectively exclude other quality rules, avoiding interference caused by failures of other quality rule checks.

  2. Notification Policy: Choose the desired notification policy based on actual needs. You can also create a new notification policy separately. For notification policy configuration details, refer to the documentation: Monitoring & Alerting System.

  3. Notified Users: Select relevant personnel who need to be aware of billing issues. You can add users to this list by creating new users in the Account Center.
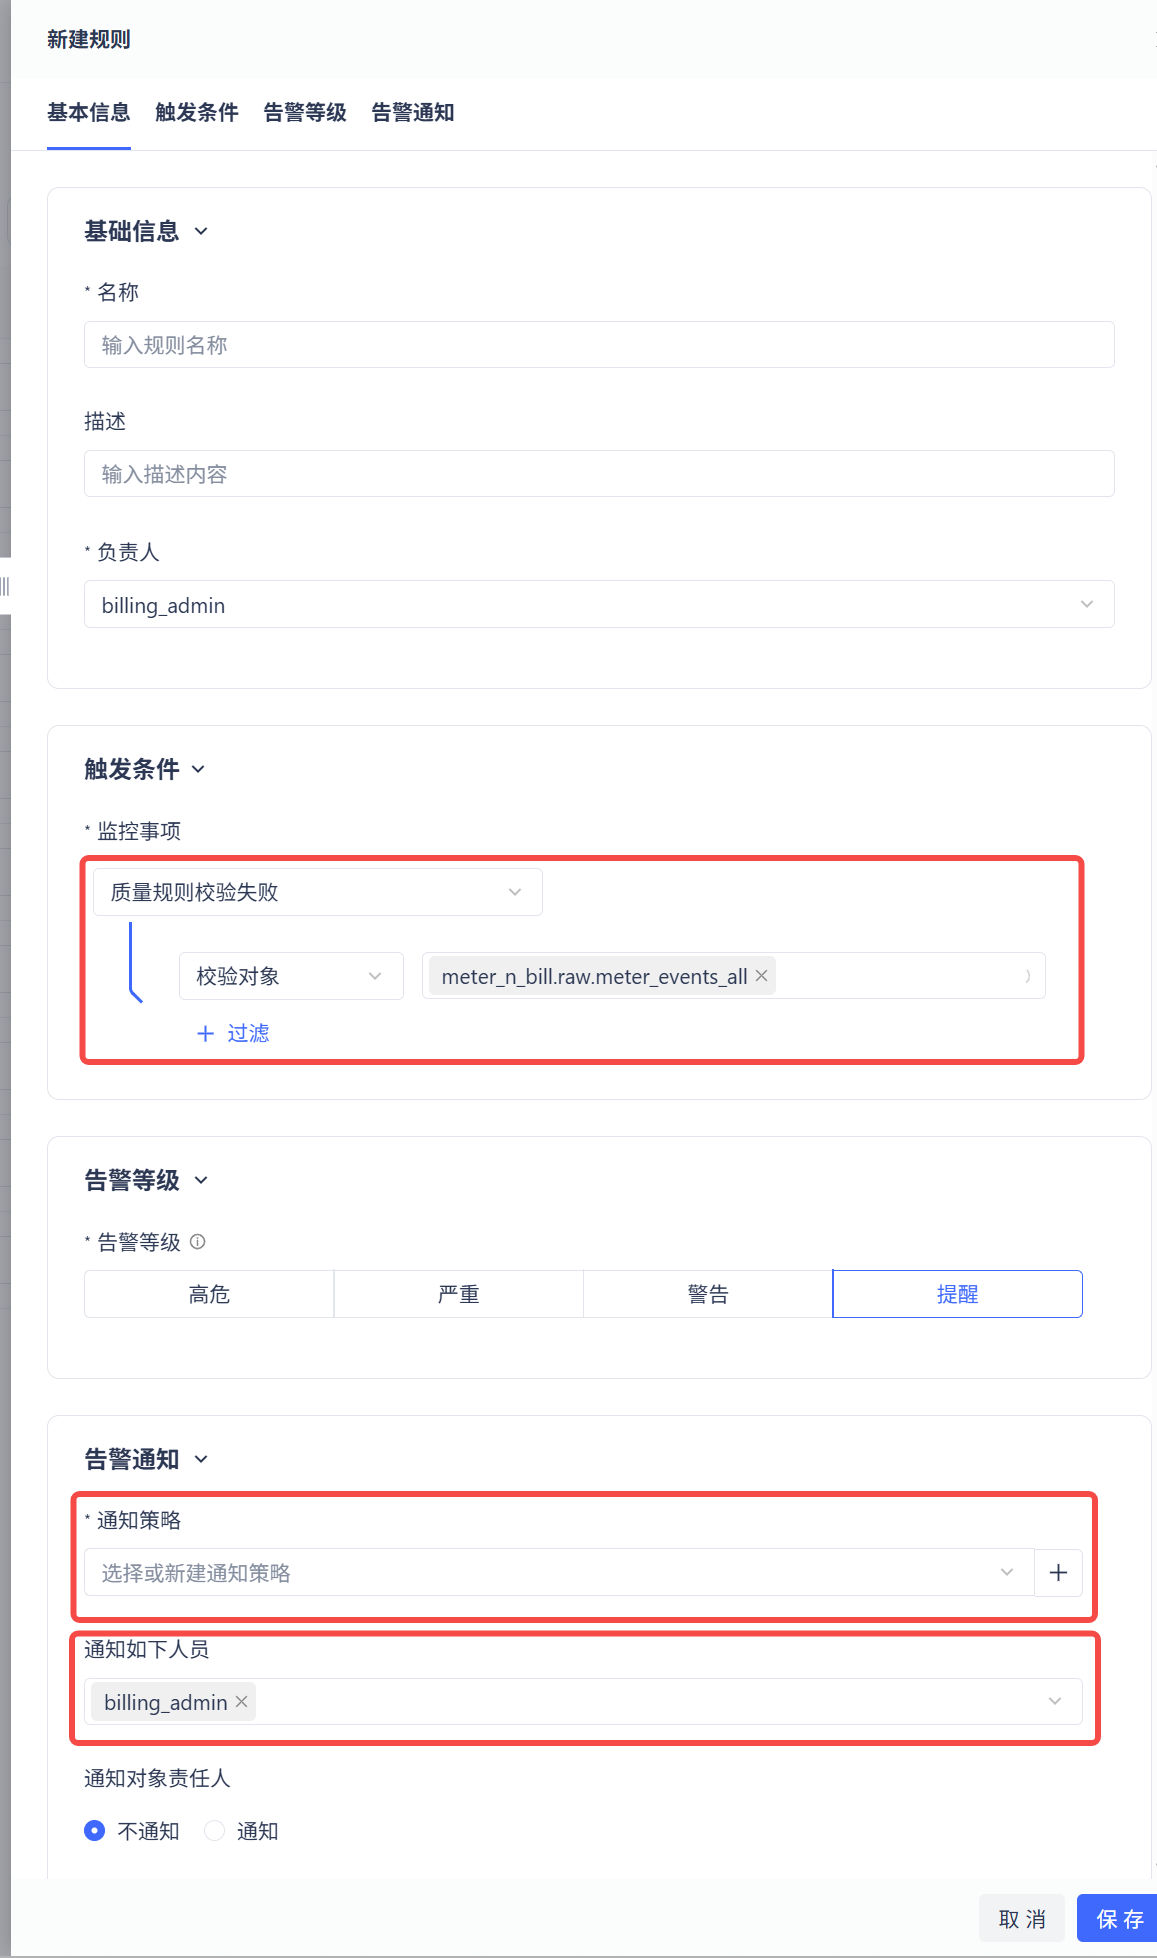
Once the above two steps are completed, the full process from monitoring to alerting is set up. When a quality rule detects an anomaly, you will receive alert notifications through the corresponding channels.

The following section details the available monitoring rules for data quality rules.

Monitoring Solutions

Solution 1: Fixed Threshold Monitoring (Simple and Fast)

Applicable Scenario: Costs are relatively stable with a clear budget ceiling.

Monitoring SQL:

-- Query yesterday's total cost SELECT ROUND(SUM(COALESCE(total_after_discount, amount * discount_rate)), 2) AS total_amount FROM sys.information_schema.instance_usage WHERE CAST(SUBSTR(measurement_start, 1, 10) AS DATE) = current_date() - INTERVAL 1 DAY

Alert Configuration:

  • Expected result <= 50 (adjust the threshold according to actual needs)
  • Trigger alert when the threshold is exceeded

Threshold Reference Query:

-- Query cost benchmarks over the past 90 days WITH day_sum AS ( SELECT CAST(SUBSTR(measurement_start, 1, 10) AS DATE) AS bill_date, SUM(COALESCE(total_after_discount, amount * discount_rate)) AS day_amount FROM sys.information_schema.instance_usage WHERE CAST(SUBSTR(measurement_start, 1, 10) AS DATE) BETWEEN date_sub(current_date(), 90) AND current_date() - INTERVAL 1 DAY GROUP BY 1 ) SELECT ROUND(MAX(day_amount), 2) AS max_daily, -- Historical maximum ROUND(AVG(day_amount), 2) AS avg_daily, -- Average value ROUND(percentile_approx(day_amount, 0.95), 2) AS p95_daily -- 95th percentile FROM day_sum

Solution 2: Dynamic Baseline Monitoring (Focusing on Anomalous Fluctuations)

Applicable Scenario: Costs exhibit a stable upward or downward trend, requiring attention to cost fluctuations rather than absolute values.

Monitoring SQL:

-- Compare yesterday's cost with the historical median WITH daily_costs AS ( SELECT to_date(substr(measurement_start, 1, 10)) AS date, SUM(COALESCE(total_after_discount, amount * discount_rate)) AS cost FROM sys.information_schema.instance_usage GROUP BY 1 ), historical_median AS ( SELECT percentile_approx(cost, 0.5) AS median_cost FROM daily_costs WHERE date BETWEEN date_sub(current_date(), 31) AND current_date() - INTERVAL 2 DAY ), yesterday_cost AS ( SELECT COALESCE(cost, 0) AS cost FROM daily_costs WHERE date = current_date() - INTERVAL 1 DAY ) SELECT CASE WHEN h.median_cost IS NULL OR h.median_cost = 0 THEN 9999.0 ELSE ROUND(y.cost / h.median_cost, 2) END AS cost_ratio FROM yesterday_cost y CROSS JOIN historical_median h

Alert Configuration:

  • Expected result <= 1.5 (i.e., yesterday's cost does not exceed 1.5 times the historical median)
  • Adjust the multiplier based on business characteristics:
    • 1.5x: Sensitive monitoring
    • 2.0x: Standard monitoring
    • 3.0x: Relaxed monitoring

Baseline Threshold Auxiliary Analysis SQL:

If you are unsure about the appropriate expected result value, you can execute the following SQL to obtain the tp90, tp95, and tp99 values from the past 30 days as a reference:

-- Analyze historical cost volatility to determine reasonable alert multipliers WITH daily_costs AS ( SELECT to_date(substr(measurement_start, 1, 10)) AS date, SUM(COALESCE(total_after_discount, amount * discount_rate)) AS daily_cost FROM sys.information_schema.instance_usage WHERE to_date(substr(measurement_start, 1, 10)) >= date_sub(current_date(), 60) AND to_date(substr(measurement_start, 1, 10)) < current_date() GROUP BY 1 ), -- Calculate the overall median of the past 30 days as a baseline baseline AS ( SELECT percentile_approx(daily_cost, 0.5) AS median_cost FROM daily_costs WHERE date >= date_sub(current_date(), 31) AND date < current_date() ), -- Calculate daily cost ratio against the baseline ratio_analysis AS ( SELECT d.date, d.daily_cost, b.median_cost, CASE WHEN b.median_cost > 0 THEN ROUND(d.daily_cost / b.median_cost, 2) ELSE NULL END AS cost_ratio FROM daily_costs d CROSS JOIN baseline b WHERE d.date >= date_sub(current_date(), 30) ) SELECT 'Historical Cost Volatility Analysis' AS analysis_type, COUNT(*) AS total_days, ROUND(MIN(cost_ratio), 2) AS min_ratio, ROUND(percentile_approx(cost_ratio, 0.25), 2) AS p25_ratio, ROUND(percentile_approx(cost_ratio, 0.5), 2) AS p50_ratio, ROUND(percentile_approx(cost_ratio, 0.75), 2) AS p75_ratio, ROUND(percentile_approx(cost_ratio, 0.90), 2) AS p90_ratio, ROUND(percentile_approx(cost_ratio, 0.95), 2) AS p95_ratio, ROUND(percentile_approx(cost_ratio, 0.99), 2) AS p99_ratio, ROUND(MAX(cost_ratio), 2) AS max_ratio FROM ratio_analysis UNION ALL -- Calculate recommended thresholds based on historical volatility SELECT 'Suggested Alert Threshold' AS analysis_type, NULL AS total_days, NULL AS min_ratio, NULL AS p25_ratio, NULL AS p50_ratio, NULL AS p75_ratio, ROUND( (SELECT percentile_approx(cost_ratio, 0.90) * 1.2 FROM ratio_analysis), 2 ) AS p90_ratio, -- Sensitive monitoring ROUND( (SELECT percentile_approx(cost_ratio, 0.95) * 1.1 FROM ratio_analysis), 2 ) AS p95_ratio, -- Standard monitoring ROUND( (SELECT percentile_approx(cost_ratio, 0.99) * 1.05 FROM ratio_analysis), 2 ) AS p99_ratio, -- Relaxed monitoring NULL AS max_ratio;

Cost Attribution Analysis SQL

The following queries are used to identify monitoring targets before configuring alerts, or to locate cost sources after an alert is triggered.

Compute Cost Summary by Workspace for the Current Month

SELECT workspace_name, sku_name, ROUND(SUM(measurements_consumption), 2) AS total_cru, ROUND(SUM(amount), 2) AS total_yuan FROM sys.information_schema.instance_usage WHERE measurement_start >= DATE_TRUNC('month', CURRENT_DATE) GROUP BY workspace_name, sku_name ORDER BY total_yuan DESC;

Storage Cost Summary by Workspace for the Current Month

SELECT workspace_name, sku_name, ROUND(SUM(measurements_consumption), 4) AS consumption, measurements_unit, ROUND(SUM(amount), 4) AS total_yuan FROM sys.information_schema.storage_metering WHERE measurement_start >= DATE_TRUNC('month', CURRENT_DATE) GROUP BY workspace_name, sku_name, measurements_unit ORDER BY workspace_name, total_yuan DESC;

Combined Storage and Compute Cost

SELECT cost_type, workspace_name, ROUND(SUM(amount), 2) AS total_yuan FROM ( SELECT 'compute' AS cost_type, workspace_name, amount FROM sys.information_schema.instance_usage WHERE measurement_start >= DATE_TRUNC('month', CURRENT_DATE) UNION ALL SELECT 'storage' AS cost_type, workspace_name, amount FROM sys.information_schema.storage_metering WHERE measurement_start >= DATE_TRUNC('month', CURRENT_DATE) ) t GROUP BY cost_type, workspace_name ORDER BY cost_type, total_yuan DESC;

Compute Cost Trend for the Past 30 Days

SELECT DATE(measurement_start) AS dt, sku_name, ROUND(SUM(amount), 2) AS daily_yuan FROM sys.information_schema.instance_usage WHERE measurement_start >= CURRENT_DATE - INTERVAL 30 DAY GROUP BY DATE(measurement_start), sku_name ORDER BY dt, daily_yuan DESC;

Notes on Cost Views

  • sys.information_schema.instance_usage records daily-aggregated compute billing data including amounts; job_history.cru records per-job consumption without final amounts and cannot substitute for the cost view.
  • sys.information_schema.storage_metering records storage and network costs; common SKUs include managed storage capacity, multi-version undeleted storage, and data query Internet data transfer.
  • workspace_name may be NULL, indicating instance-level costs not attributed to a specific workspace.
  • amount is the original amount; total_after_discount is the discounted amount. Alert rules should preferably use COALESCE(total_after_discount, amount * discount_rate).

Monitoring Effect Verification

  1. Manual Test: After configuring the quality rule, you can perform a trial run to verify the correctness of the quality rule configuration and the SQL.
  2. Alert Testing: During the trial run, you can (manually) trigger the alert to verify the notification functionality, confirming that the notification policy configuration is correct.
  3. Historical Review: Review the billing data from the past 7 days to confirm the reasonableness of the threshold.

By following the above steps, you can quickly set up a billing anomaly alert system and effectively control cost risks.