
Enterprise Data Engineering Platforms for Batch and Streaming: How to Build a Defensible Shortlist
A practical framework for choosing an enterprise data engineering platform for batch and streaming: needs assessment, testable evaluation criteria, red flags, a named shortlist with fit notes, and an acceptance checklist.
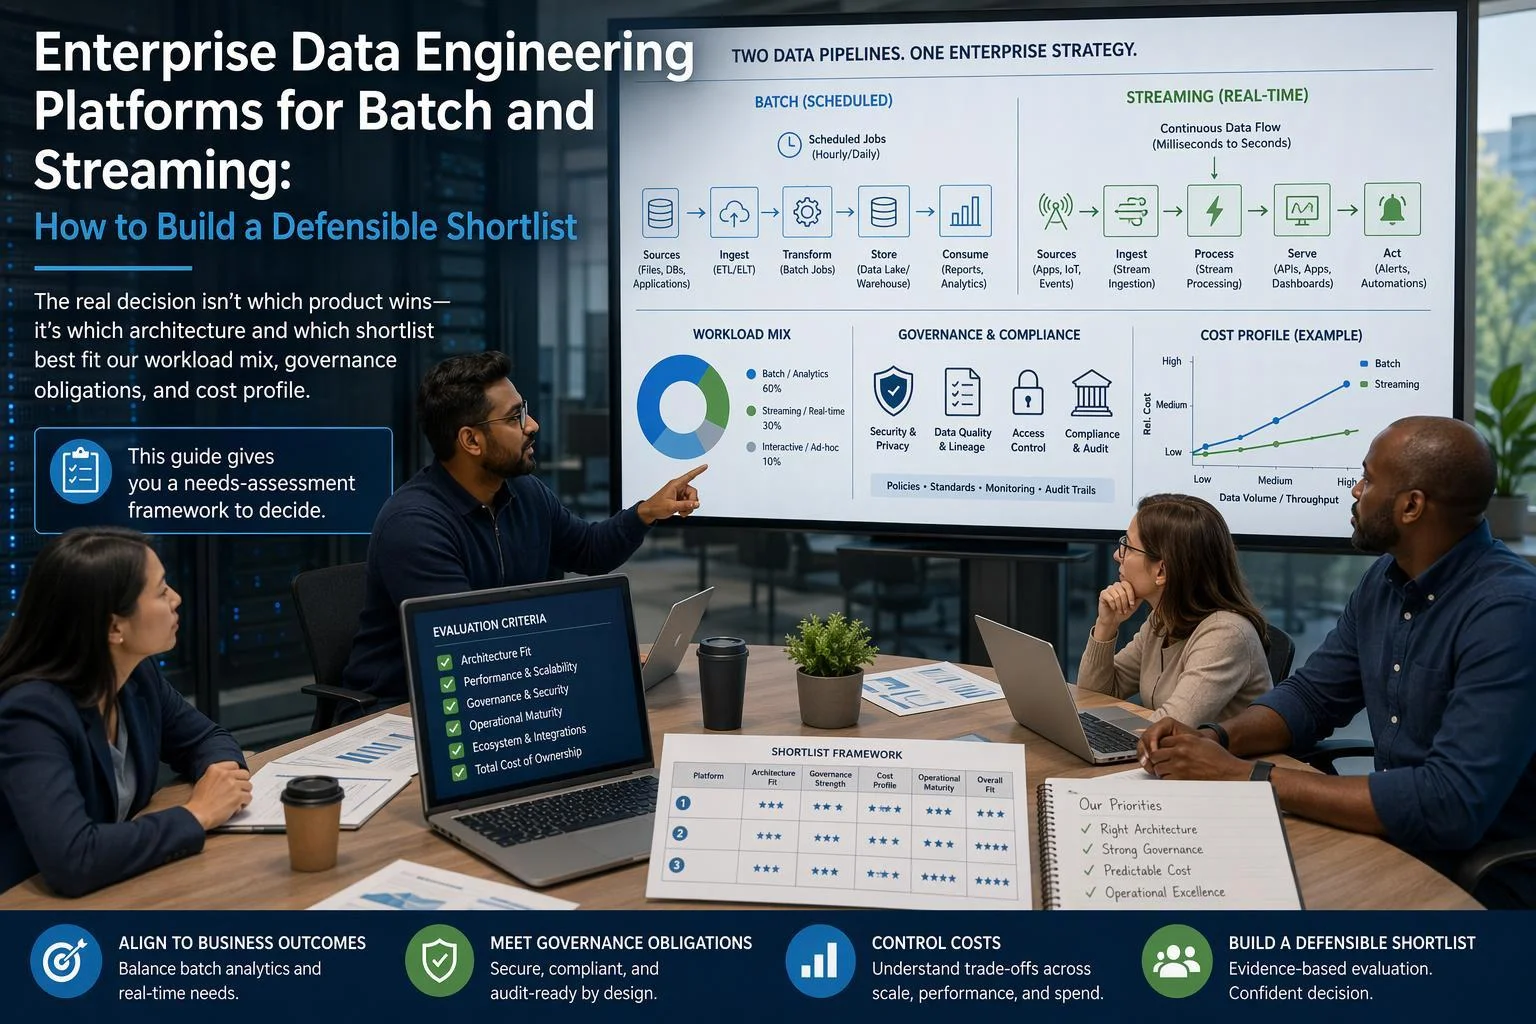
The question is rarely "which platform is best." It is which architecture fits your workload mix, which shortlist follows from that architecture, and how you will prove the vendor's claims before you sign. Those three decisions are linked: a workload profile that is 90% batch does not need the same platform as one with sub-second fraud scoring on the critical path, and a shortlist built without that distinction tends to compare products on features rather than on fit.
This guide works through the sequence in order. It starts with a needs assessment you can complete before any vendor demo, moves to evaluation criteria you can test in your own environment, and then sets out red flags that should remove a candidate from consideration. It closes with a named shortlist carrying honest fit notes and cautions, a method for validating performance and cost claims, and an acceptance checklist you can put in front of procurement.
One convention applies throughout. Vendor performance and pricing figures are treated as claims to reproduce under your conditions, not as established facts. Where a figure appears, it is attributed to the vendor that published it and paired with the test that would confirm or refute it in your environment.
Start With a Needs Assessment, Not a Vendor Demo
A demo answers the vendor's question, not yours. Before you take meetings, build a short written profile of the estate you are actually running: the pipelines you have, the latency each one needs, the volume and growth rate behind it, the regulatory constraints on where data can sit, and the skills your team can staff. That profile becomes the scoring sheet every candidate is measured against, and it is the document that keeps a shortlist defensible when a stakeholder champions a product for reasons unrelated to fit.
Map Workloads to Latency Tiers
Classify each pipeline into a latency tier before comparing platforms. Databricks documents a useful split: micro-batch mode processes new data in small batches for analytical pipelines and ETL workloads with latency requirements measured in seconds or minutes, while real-time mode processes records as they arrive for sub-second operational workloads such as fraud detection and real-time personalization (Databricks, batch vs. streaming). Those two tiers imply different engineering commitments, not just different settings.
A third tier — scheduled batch — covers the majority of most estates and needs no streaming semantics at all. Assign tiers by business consequence: what breaks, and how expensively, if this number is ten minutes old rather than one second old. Vendor figures are useful only as reference points for what a tier can cost. Snowflake, for example, reports that its high-performance Snowpipe Streaming architecture ingests at up to 10 GB per second per table with ingest-to-query latencies typically under 10 seconds — a vendor-reported figure you would reproduce on your own data, not a specification of what your pipeline will achieve.
Decide Whether You Need One Unified Platform or a Batch-Plus-Streaming Stack
The unified case rests on consolidation: one engine, one copy of data, one governance surface, one skill set to hire and retain, and no reconciliation between a batch path and a streaming path that compute the same metric differently. The separate-stack case rests on fit and independence: best-of-breed per workload, protection of existing investment and team specialization, and no lock-in to one vendor's semantics for both paths.
The practical test is a count, not an argument. For your actual workload mix, tally the pipelines, the engines and the copies of data each option implies, then weigh that against the operational headcount each requires. A separate stack that adds two engines and a third copy of the same table is a real cost, and so is a unified platform whose streaming tier is too shallow for your sub-second work. Treat "unified" as an architecture claim to verify — whether batch, streaming and interactive queries genuinely run on one engine and one copy of data — rather than a category label to accept.
Evaluation Criteria You Can Test in Your Own Environment
Score every candidate against the same criteria, and for each one define the test that produces evidence rather than a datasheet quote. The five below cover the areas where platform differences most often decide the outcome.
Latency and Throughput Under Realistic Load
Measure end to end — from source event to queryable result — at your volumes and concurrency, and separate ingestion latency from transformation and query latency so you know which stage to tune. Treat published figures as starting points to reproduce: Snowflake's reported 10 GB per second per table and sub-10-second ingest-to-query latency describe its high-performance Snowpipe Streaming architecture under vendor conditions, not yours.
Replay, Recovery and Exactly-Once Semantics
Replay and recovery determine whether a streaming pipeline is trustworthy. Flink documents fault tolerance built on a combination of stream replay and state snapshots, which restores state to a consistent point and yields exactly-once processing semantics (Apache Flink, stateful stream processing). Delta Lake documents that its transaction log guarantees exactly-once processing even when other streams or batch queries run concurrently against the table (Databricks, Delta Lake streaming).
The operational questions are how far back you can replay and how long recovery takes. Delta Lake's documented behavior illustrates why: a streaming query reading a Delta table must run at least once within the source table's retention window — by default 7 days for VACUUM-removed data files and 30 days for the transaction log — or it fails and requires a full refresh. Probe this with failure injection: kill a job mid-stream, measure time to consistent state, and confirm the replay depth your recovery plan assumes.
Workload Isolation and Concurrency
Run a heavy batch job and a latency-sensitive stream at the same time, then watch tail latency rather than averages. Isolation models differ in what they trade: Snowflake's multi-cluster warehouse policies are a documented example, where Standard favors starting additional clusters over conserving credits, while Economy favors keeping running clusters fully loaded and may queue queries instead (Snowflake, multi-cluster warehouses). Test the setting under your own concurrency profile.
Governance, Lineage and Security Across Both Paths
Governance has to be continuous when batch and streaming paths coexist: one catalog, access policy applied identically to streaming-ingested and batch-loaded tables, lineage from ingestion through transformation to consumption, and audit history. Table formats carry some of this — Delta Lake logs change details as an audit trail, and Iceberg documents serializable isolation with atomic table changes (Apache Iceberg) — but platform-level policy enforcement and lineage are separate capabilities to verify. Test by tracing one record from source to dashboard across both paths.
Cost Behavior Under Mixed Workloads
Total cost under mixed workloads is driven by pricing-model fit, idle capacity and data movement, not by list price per unit. The structures differ in how they behave when workloads are spiky or idle. BigQuery offers on-demand pricing per TiB processed or capacity-based pricing in slots over time, with autoscaling and optional one- and three-year commitments (BigQuery pricing). Snowflake bills per second with a 60-second minimum each time a warehouse starts, and auto-suspend is enabled by default (Snowflake, warehouses). Databricks bills pay-as-you-go at per-second granularity and offers committed-use contracts (Databricks pricing). Model your own monthly profile against each, including idle hours.
Red Flags and Deal-Breakers
Red flags are distinct from unmet criteria. A criterion you score poorly is a trade-off to weigh; a red flag is a signal that should remove a candidate from the shortlist or force deep scrutiny before it advances. Keep both lists as observable behaviors and contractual or architectural facts, so that a disqualification can be defended in a review rather than argued as a preference.
Architecture and Lock-In Red Flags
Ask for documents, not assurances, on each of the following.
Proprietary storage with no documented export path. Request the documented export mechanism and the format it produces.
Append-only streaming with no documented upsert or CDC path when your pipelines carry updates and deletes. Confirm how the platform handles them.
A "unified" claim that on inspection requires separate engines for batch, streaming and interactive queries. Ask for the architecture diagram and the compute units behind each path.
Governance that covers only one path. Ask whether the same policy applies to streaming-ingested tables.
No documented replay or recovery mechanism. Request the retention windows and the recovery procedure.
Commercial and Operational Red Flags
On the commercial side, treat these as disqualifiers until resolved: pricing that cannot be modeled from published structures, so you cannot forecast a bill; commitments that lock capacity you cannot flex when workload mix changes; undocumented idle-capacity behavior; unclear support boundaries for streaming incidents, including who owns recovery when a pipeline stalls at 2 a.m.; and migration paths that require rewriting pipelines rather than porting them. Ask each vendor to state, in writing, the pricing unit, the idle behavior, the support escalation path for streaming incidents, and the exit terms.
A Named Shortlist With Honest Fit Notes
The candidates below are platforms to test against your profile, not a ranking. Each entry gives the documented architecture, a best-fit note and a main caution.
Databricks (Delta Lake and Structured Streaming)
Delta Lake is an open-source storage layer that extends Parquet with a file-based transaction log for ACID transactions, is compatible with Spark APIs, and was built for tight integration with Structured Streaming so one copy of data serves batch and streaming (Databricks, Delta Lake). Best fit: teams already on Spark with heavy batch plus micro-batch analytics. Main caution: verify Spark-based compute cost under your mix, and confirm streaming semantics match your pipeline design — updates or deletes to a source table require handling, and Databricks documents options including skipChangeCommits, full refresh, change data feed and materialized views, each with trade-offs.
Snowflake (Snowpipe Streaming and Dynamic Tables)
Snowpipe Streaming's high-performance architecture is documented for large-scale, real-time ingestion, with vendor-reported throughput of up to 10 GB per second per table and ingest-to-query latency typically under 10 seconds (Snowflake release notes). Dynamic tables let you declare a target lag and choose incremental, full or automatic refresh (Snowflake, dynamic tables). Best fit: warehouse-centered organizations with SQL-centric teams and growing streaming ingestion. Main caution: confirm the ingestion path covers your update and CDC patterns, and model cost against per-second billing with a 60-second minimum.
Google Cloud (BigQuery and Dataflow)
Dataflow provides unified stream and batch processing at scale, with exactly-once processing by default for streaming and an at-least-once option (Dataflow overview). BigQuery documents batch load jobs and streaming paths via Dataflow or the Storage Write API (BigQuery, loading data), alongside its on-demand and capacity pricing models. Best fit: Google Cloud-centric organizations wanting managed processing plus a warehouse with flexible pricing. Main caution: verify multi-cloud requirements, and model the on-demand versus capacity choice separately, since they behave very differently under spiky load.
Microsoft Fabric (Eventstreams and Lakehouse)
Fabric eventstreams document a wide source list, including Apache Kafka, Azure Event Hubs, Amazon Kinesis, several database CDC connectors and MQTT, with no-code and SQL-based stream processing and destinations such as Eventhouse and Lakehouse, where events are converted to Delta Lake format (Microsoft Learn, Eventstreams overview). It suits Microsoft-centric organizations that want streaming ingestion and lakehouse storage inside one capacity-based platform. Verify capacity sizing and licensing: Microsoft's own licensing table notes that viewing Power BI content with a free license depends on the F SKU reaching F64 (Microsoft Learn, Fabric licenses), so the user base affects the purchase. Confirm stream processing depth meets your latency tier.
Apache Flink (Self-Managed or Managed, e.g., Amazon Managed Service for Apache Flink)
Flink implements fault tolerance through a combination of stream replay and state snapshots, restoring operator state to recover exactly-once processing semantics (Apache Flink, stateful stream processing). Managed options such as Amazon Managed Service for Apache Flink target teams that need fine-grained control over state (Amazon Managed Service for Apache Flink). This is the right candidate when sub-second operational latency is a genuine requirement and you can staff stateful streaming. The caution is steady-state cost: streaming jobs hold compute continuously, so model average resource consumption, not peak, and confirm the team can operate checkpoints, upgrades and recovery.
Open Table Formats as the Interoperability Layer (Iceberg, Delta Lake, Hudi)
The table format can outlast the platform. Apache Iceberg documents schema evolution, hidden partitioning, time travel and serializable isolation, with readers never seeing partial or uncommitted changes, and it is built as an open specification read by Spark, Trino, Flink and others. Delta Lake documents ACID transactions, time travel, audit history and UniForm interoperability; Hudi documents its table types for update-heavy workloads. Open formats reduce storage lock-in, but they do not by themselves deliver governance, streaming semantics or operational simplicity. Those remain platform responsibilities to test.
Singdata Lakehouse (Vendor Context)
Singdata positions its lakehouse as one engine covering batch, streaming and interactive compute over a single copy of data, with incremental compute, Iceberg-based open storage and cloud-agnostic deployment across several hyperscalers. Treat its published performance and cost comparisons as vendor-reported claims to reproduce against the criteria above, not as established results. Evaluate it as one candidate among several, scoring it on the same latency, recovery, isolation, governance and cost tests you apply to the others.
How to Validate Vendor Performance and Cost Claims
A vendor benchmark answers a question the vendor chose. To turn a claim into evidence, restate it as a metric with explicit boundaries before you test anything: what is measured (ingestion only, or source to queryable result), at what data volume, at what concurrency, on which hardware or warehouse size, and over what period. Most published figures omit at least one of these, which is why they rarely transfer to a buyer's estate.
Take Snowflake's documented claim for the high-performance Snowpipe Streaming architecture: ingest at up to 10 GB per second per table with ingest-to-query latencies typically under 10 seconds. That is a vendor-reported figure for a specific architecture, and it describes one table's ingestion path. Your test should measure the same quantity end to end on your data, at your event sizes and key distributions, with your transformation layer included, and with the concurrency your dashboards actually generate. If your pipeline adds joins, deduplication or CDC merges after ingestion, the number that matters is the one after those steps.
Run the identical test across candidates. Same dataset, same source rate, same query set, same measurement instrumentation, same duration. Record the conditions alongside the result so the comparison survives a change of personnel. Where a vendor cannot state the conditions behind a published number, treat the number as marketing rather than a starting point.
Cost validation follows the same discipline. Build a monthly model from your own usage profile rather than from list prices: peak and average ingest volume, query concurrency by hour of day, batch windows, idle periods overnight and at weekends, storage growth, and data movement across regions or clouds. Then apply each candidate's pricing structure to that profile.
The structures behave differently under the same profile. BigQuery documents on-demand pricing per TiB processed alongside a capacity model priced in slots over time, with pay-as-you-go autoscaling and optional one- and three-year commitments at a discount. Snowflake documents per-second billing with a 60-second minimum each time a warehouse starts, plus auto-suspend when a warehouse is idle. Databricks documents pay-as-you-go billing at per-second granularity and committed-use contracts for discounts. A spiky workload and a steady one can rank these three structures in opposite orders, which is exactly why the model has to use your profile.
Stress-test the model against three scenarios: a quiet month, a month with a large backfill, and twelve months of growth at your forecast rate. The backfill scenario matters because replaying history is a normal operation, not an exception, and it can dominate a consumption-based bill. If a pricing structure cannot be modeled from published information, ask the vendor for a written worked example at your volumes before the proof of concept, not after.
Using the Criteria to Decide
The decision combines four inputs: the needs assessment, the criteria scores, the red-flag findings and the validation results. Weight the criteria by your own workload profile rather than using a generic scorecard. An organization whose streaming share is small and whose batch estate is large should weight cost behavior and batch throughput heavily and treat sub-second latency as a secondary criterion. An organization running operational workloads on the same estate should invert that weighting.
Run a structured proof of concept on the top two candidates, not on five. Define the exit criteria in advance: the specific latency percentile, the recovery time after an injected failure, the tail-latency ceiling under concurrent batch load, the end-to-end lineage trace, and the modeled monthly cost. Score both candidates against the same criteria and keep the raw measurements.
Then close the commercial questions in writing. Ask for the pricing behavior at your modeled volumes, including what happens when usage falls below a commitment and how overage is billed. Ask what the support boundary is for a streaming incident at 2 a.m.: who diagnoses it, what the response target is, and whether the vendor's engineers can access your environment. Ask for the exit terms: how data leaves in an open format, how long export takes at your volume, and what happens to pipelines that depend on proprietary semantics.
The decision is between architectures as much as products. A unified platform that scores well but requires your team to learn a new programming model may cost more in the first year than a separate stack your engineers already operate. A separate stack that wins on workload fit may lose on governance if nobody owns the cross-path lineage. Make the trade-off explicit in the decision record rather than letting the scorecard hide it.
Acceptance Checklist
Use this list as the acceptance gate for whichever architecture and candidate you select. Each item is observable and should be evidenced with a measurement or a document, not a verbal assurance.
Latency measured end to end on representative data at target concurrency, with the measurement boundary written down (source timestamp to queryable result, including transformation).
Failure-injection test passed: the recovery time and the replay depth you can reach are both confirmed, and the retention window that bounds replay is documented.
Exactly-once or explicitly documented delivery semantics confirmed for your update and CDC patterns, including what happens when a source table receives updates or deletes.
Batch, streaming and interactive workloads run concurrently without tail latency exceeding the ceiling you set in advance.
One record traced from source to consumption across both a batch and a streaming path, with lineage and access policy intact at every hop.
Monthly cost modeled from your own usage profile under each candidate's pricing structure, including idle, spike and backfill scenarios.
Data export and engine portability confirmed against documented formats and export paths, with a timed trial export at realistic volume.
Commercial terms reviewed for commitment flexibility, support boundaries during streaming incidents, and exit provisions.
FAQ
These are the questions that tend to surface after the framework is applied.
Do we need a single unified platform, or is a separate batch-plus-streaming stack fine?
Either can be correct. A separate stack fits when streaming needs are narrow, the team is already specialized, and existing investments work. A unified platform tends to win when pipelines, engines and data copies are proliferating and governance must span both paths. Your needs assessment decides it: count the pipelines, engines and copies each option implies for your actual workload mix.
How much of our data actually needs real-time processing?
Answer it from your pipeline inventory, not from ambition. Classify each pipeline by the business consequence of its latency, then sum the volume that genuinely requires sub-second or seconds-level freshness. That share usually determines whether streaming is a first-class platform requirement or a targeted capability served by one component.
Can we trust vendor benchmark and cost figures?
Not as stated. Treat them as claims to reproduce under your own conditions, using the validation method above: define the metric boundary, reproduce it on representative data, run the same test across candidates, and require the vendor to state the conditions. A figure without stated conditions is marketing.
How do we keep governance consistent across batch and streaming?
Use one catalog and one policy enforcement point for both paths, require lineage that spans ingestion through transformation to consumption, and make the end-to-end trace test an acceptance criterion. Table formats carry some audit and isolation properties, but platform-level policy enforcement and lineage are separate capabilities you must verify.
What is the biggest cost risk in a mixed-workload platform?
Idle and spiky capacity under commitment-based or always-on pricing. Streaming compute runs continuously, batch windows spike, and commitments lock a floor you may not need. The mitigation is modeling your own monthly profile against each pricing structure, including quiet months and backfill months, before you sign.
Previous posts
https://www.singdata.com/company
https://singdata.com/trending/powerbi-date-difference-dax-calculations/