How Enterprises Apply 7-Day Order Forecast to Unlock Operational Gains

A 7-Day Order Forecast empowers enterprises to anticipate demand shifts and adjust inventory levels quickly. Companies like Johnson & Johnson and Walmart have achieved up to 15% inventory reductions and fewer stockouts by using statistical safety stock optimization and collaborative planning. Advanced analytics and automated inventory systems help set dynamic reorder points, which adapt to real-time demand changes. This approach improves cash flow, reduces holding costs, and enables better resource allocation, giving enterprises a clear competitive edge.
Key Takeaways
A 7-Day Order Forecast helps companies guess what customers will buy soon.
This stops running out of products and having too much extra.
It makes customers happier and saves money.
Using up-to-date data and smart tools helps companies change their stock fast.
This helps them have more money and pay less for storage.
Linking forecast tools with automatic ordering makes things move faster.
It also helps stop mistakes people might make.
Teams must work together and keep data organized to make good guesses.
This helps them react quickly when things change.
Starting with a small test and checking results often helps companies get better at guessing orders.
This way, they can use forecasting in more places and do it well.
7-Day Order Forecast: Key Benefits for Enterprises
Reducing Stockouts and Excess Inventory
Enterprises often struggle with finding the right balance between too much and too little inventory. The 7-Day Order Forecast helps companies predict demand with greater accuracy. This approach allows teams to adjust stock levels before shortages or surpluses occur. By using real-time data and advanced analytics, managers can identify which products need replenishment and which items risk becoming obsolete. As a result, businesses experience fewer stockouts, avoid lost sales, and reduce the costs associated with excess inventory. This balance supports a healthier supply chain and improves customer satisfaction.
Improving Cash Flow and Cost Control
Effective inventory management directly impacts a company’s financial health. The 7-Day Order Forecast enables organizations to align purchasing decisions with actual demand. This alignment reduces the amount of capital tied up in unsold goods. Companies can invest more in growth opportunities rather than holding unnecessary stock. Lower inventory levels also decrease storage and insurance costs. With better visibility into upcoming needs, finance teams can plan budgets more accurately and control expenses. This proactive approach leads to stronger cash flow and improved profitability.
Enhancing Operational Agility and Responsiveness
Modern enterprises must respond quickly to market changes. The 7-Day Order Forecast provides real-time insights that drive agile decision-making.
Executives can adjust production schedules and inventory levels dynamically.
Machine learning models improve demand prediction, optimizing labor and machine use.
Integration of supply chain data helps mitigate risks from disruptions.
Real-time demand insights allow rapid response to customer needs.
Automation and software tools streamline order processing and warehouse operations.
These capabilities enable companies to sense demand shifts ahead of competitors and adapt quickly. Flexible processes and predictive analytics ensure essential products remain available, even during demand spikes. This agility strengthens the company’s position in a fast-moving market.
Understanding the 7-Day Order Forecast Process

Identifying Demand Drivers
Successful forecasting begins with understanding what influences demand. Enterprises must identify the key factors that cause changes in customer orders. These factors, known as demand drivers, can shift quickly and impact forecast accuracy. The table below outlines the most important demand drivers and their effects on a 7-Day Order Forecast:
Key Demand Driver | Description and Impact on 7-Day Order Forecast Accuracy |
|---|---|
Volatile Consumer Behaviour | Rapid and unpredictable changes in consumer preferences cause difficulty in accurately predicting short-term demand fluctuations. |
External Factors | Weather, competition, macroeconomic conditions, social media buzz introduce variability that complicates manual forecasting efforts. |
Seasonality | Periodic demand spikes require precise modeling to avoid stock-outs or overstocking, critical even in short-term forecasts. |
Number of SKUs | High SKU counts increase forecast granularity and complexity, making manual short-term forecasts time-consuming and error-prone. |
Data Quality and Availability | Poor or insufficient data leads to erroneous forecasts, directly reducing accuracy in short-term horizons like 7 days. |
Long Lead Times | Longer forecast horizons increase uncertainty, but even short-term forecasts are sensitive to lead time variability. |
Customer Development | Predicting demand from new customers is more complex, affecting forecast reliability. |
Scenario Analysis | Considering multiple demand scenarios is challenging but necessary to improve forecast robustness. |
Multi-channel Complexity | Multiple sales channels and locations add layers of complexity, impacting forecast precision. |
Human Factors | Manual forecasting is prone to errors and lack of adaptability, reducing accuracy especially in dynamic short-term forecasts. |
Tip: Enterprises that monitor these demand drivers closely can adjust their forecasts quickly, reducing the risk of stockouts or excess inventory.
Collecting and Segmenting Data
Accurate forecasting depends on high-quality data. Enterprises must collect data from sales, inventory, promotions, and external sources. Segmenting this data helps teams focus on the most important products and locations. Good segmentation improves forecast accuracy and makes the process more efficient.
Define what "good" forecast accuracy means for each product. Consider demand volume, speed, and variability.
Use advanced segmentation to group products by how easy they are to forecast. This can be done at the product or location level.
Create forecastability scores for each segment. Set realistic accuracy targets based on these scores.
Focus on segments with the highest impact. These are often products with high sales or high variability.
Compare actual forecast results to what is possible for each segment. This helps validate improvements.
Enterprises often use ABC classification for demand volume and XYZ classification for demand variability. This approach helps prioritize which products need the most attention. Teams measure forecast accuracy with metrics like SMAPE, MAPE, and WMAPE. They set baseline forecasts using historical data, then track improvements over time. Dashboards make it easy to see which segments are improving and where to focus next.
Note: Tailoring forecast strategies for each segment ensures that resources go where they matter most, especially for a short-term horizon like 7 days.
Applying Forecasting Models and Technology
Modern forecasting relies on advanced models and technology. Enterprises use machine learning, statistical algorithms, and automation to improve the accuracy of a 7-Day Order Forecast. These tools analyze large amounts of data quickly and find patterns that humans might miss.
Segment SKUs using ABC and XYZ methods to focus on high-impact products.
Apply statistical models, such as exponential smoothing or ARIMA, to predict short-term demand.
Use machine learning to detect trends and adjust forecasts in real time.
Measure forecast accuracy with clear metrics and compare results to baseline forecasts.
Monitor performance with dashboards and adjust models as needed.
Automation plays a key role. Automated systems can update forecasts daily, respond to new data, and trigger orders without manual input. This reduces errors and speeds up the supply chain. By combining segmentation, advanced models, and automation, enterprises achieve more reliable forecasts and better operational results.
Pro Tip: Regularly review and update forecasting models to keep up with changing demand patterns and new data sources.
Calculating Order Quantities
Enterprises rely on precise calculations to determine how much inventory to order for the upcoming week. The process starts with analyzing recent sales data, customer engagement, and distributor interactions. Teams use these insights to predict the right order quantities, reducing the risk of overstocking or running out of products.
A data-driven approach improves accuracy. Companies often use regression models to identify which variables most influence order amounts. For example, cumulative website visits and direct contact with distributors both show strong positive effects on order size. Historical order amounts also play a role, reflecting established buying patterns. However, the impact of visits can decrease at very high levels, showing diminishing returns.
The table below summarizes how different variables affect order quantity calculations:
Variable | Tobit Coefficient | Interpretation |
|---|---|---|
Cumulative visits | 14,149.12 | More visits lead to higher orders. |
Contact distributor | 34,150.85 | Distributor contact boosts orders significantly. |
Historical order amount | 0.35 | Past orders predict future order size. |
Square of cumulative visits | -328.02 | Very high visit counts show diminishing returns. |
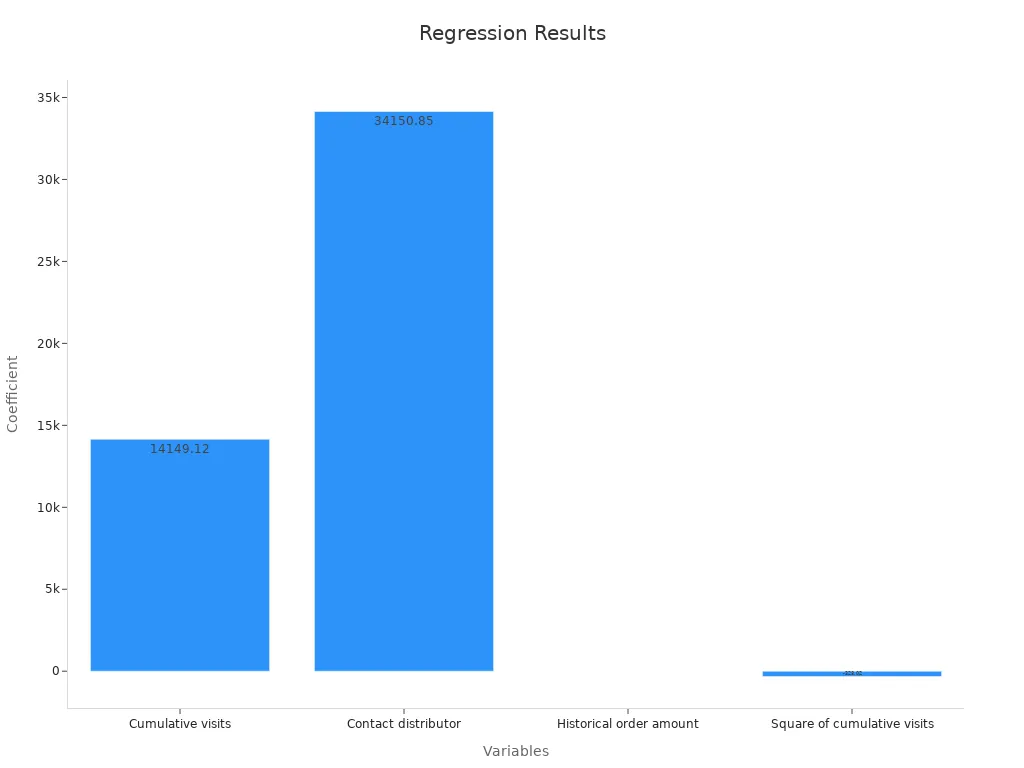
These findings confirm that integrating clickstream data and distributor interactions leads to more accurate and responsive order quantity calculations. Enterprises that use these models can adjust inventory levels quickly, keeping supply chains efficient and responsive.
Tip: Teams should regularly review which variables have the most impact on order quantities. Adjusting models as new data becomes available ensures ongoing accuracy.
Integrating Forecasts into Automated Ordering Systems
Automated ordering systems transform how enterprises manage inventory. By integrating forecasts directly into these systems, companies can trigger purchase orders, schedule deliveries, and update stock levels without manual intervention. This integration reduces human error and speeds up the entire supply chain.
The 7-Day Order Forecast plays a central role in this process. Forecasts generated by advanced models, such as SARIMAX or hybrid algorithms, feed directly into automated platforms. These systems monitor forecast accuracy using metrics like MAPE (Mean Absolute Percentage Error) and WAPE (Weighted Absolute Percentage Error). Lower error rates mean better alignment between predicted and actual demand.
The table below highlights improvements seen in several countries after integrating AI-driven forecasts into automated ordering systems:
Country | Metric | Manual Forecast (Baseline) | AI-driven Forecast (SARIMAX or Hybrid) | Improvement |
|---|---|---|---|---|
Italy | 7-day MAPE | Higher (baseline) | Significant reduction in error rate | |
Spain | 7-day MAPE | Higher (baseline) | 12.56% lower than manual | Noticeable improvement |
France | 7-day MAPE | 8.15% | 7.9% | Comparable performance |
In addition, hybrid models have reduced WAPE from 30.79% to 7.94% on sample time series. These improvements help companies allocate logistics resources more efficiently and control costs. A user testimonial also confirms that automated forecasts improve service quality and resource management.
Note: Automated ordering systems work best when teams monitor forecast accuracy and adjust models as needed. Continuous improvement ensures that inventory stays aligned with real demand.
Real-World Applications of 7-Day Order Forecast

Retail: Preventing Stockouts and Lost Sales
Retailers face constant pressure to keep shelves stocked and meet customer expectations. A 7-Day Order Forecast helps retail teams anticipate demand spikes and avoid empty shelves. Store managers use real-time sales data and short-term forecasts to adjust orders quickly. This approach reduces lost sales and improves customer satisfaction. Retailers also minimize markdowns on excess inventory, which protects profit margins. By responding to trends and promotions in near real time, retailers maintain optimal stock levels and build stronger customer loyalty.
Manufacturing: Lowering Excess Inventory
Manufacturers benefit from precise short-term forecasting by reducing excess inventory and improving supply chain performance. Case studies show that each 1% reduction in forecast error leads to about a 0.4% decrease in inventory levels. A 10% boost in forecast accuracy can cut excess inventory by 4%. Digital twin simulations help manufacturers measure the impact of improved forecasting on inventory and shortages. Many companies report forecast improvements of 20% to 30%, which results in even greater inventory reductions.
1% lower forecast error = 0.4% less inventory.
10% better forecast accuracy = 4% less excess inventory.
Digital twins simulate supply chain changes for better planning.
Some manufacturers achieve 20-30% forecast improvement.
Metric | Result |
|---|---|
Excess inventory reduction | 30% within 12 months |
Stock redistribution | Enabled new sales opportunities |
Supplier relations | Improved with transparency |
Cash flow | Enhanced by freeing capital |
These results highlight how manufacturers use advanced forecasting and real-time data to optimize inventory and strengthen supplier relationships.
Distribution: Streamlining Procurement and Logistics
Distributors rely on accurate short-term forecasts to optimize procurement and logistics. The 7-Day Order Forecast enables better stock management, reduces waste, and improves labor efficiency. Quantitative data shows a 15% increase in stock management optimization and a 49% rise in sales forecast accuracy. Wastage rates drop by 20%, and supply chain forecasting accuracy improves by 20%. Overtime hours fall from 25% to 8%, and warehouse consolidation becomes possible, with 20 out of 28 warehouses closed.
Metric | Improvement/Result |
|---|---|
Stock management optimization | 15% increase |
Sales forecast accuracy | 49% increase |
Wastage rate reduction | 20% decrease |
Supply chain forecasting accuracy | 20% increase |
Overtime hours usage rate | Reduced from 25% to 8% |
Warehouses closed | 20 out of 28 warehouses closed |
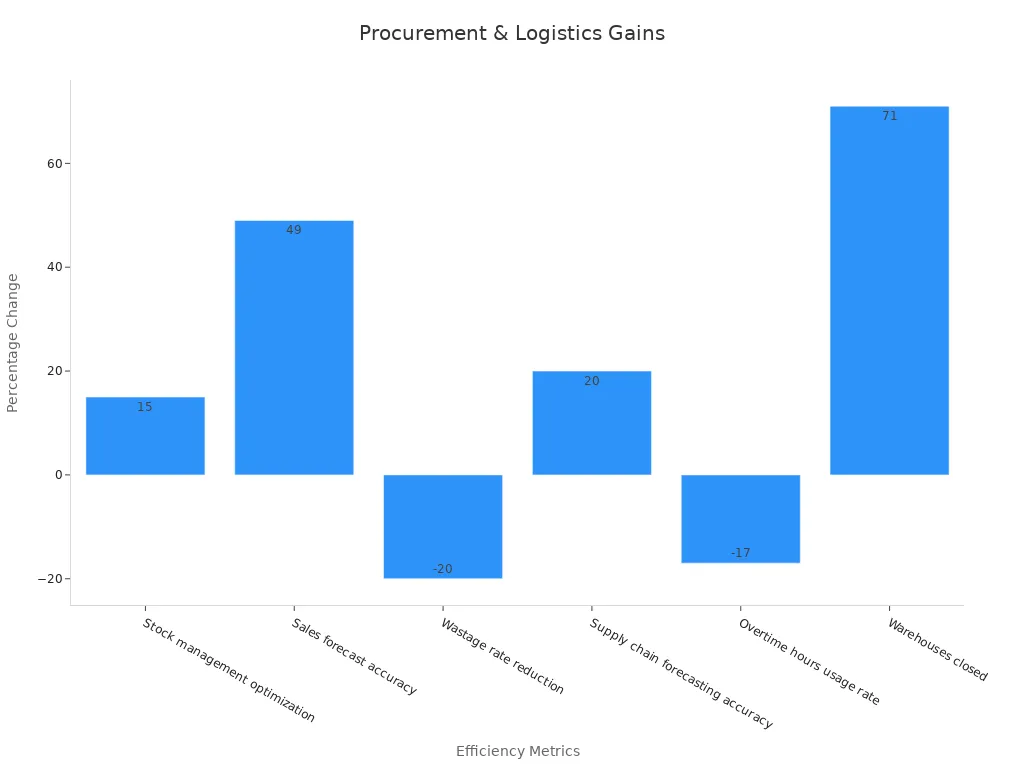
These improvements demonstrate how distributors use short-term forecasting to streamline operations, reduce costs, and improve service levels.
Overcoming Challenges in 7-Day Order Forecast Implementation
Addressing Data Quality and Consistency
Enterprises often encounter data quality issues when implementing short-term forecasting. Accurate, complete, and timely data forms the foundation of reliable forecasts. Many organizations improve data consistency by establishing end-to-end visibility across all supply chain levels, from central warehouses to local facilities. Teams develop tools and databases at the facility level to track actual product movement, which increases forecasting accuracy. Standardizing forecasting tools at the national level also helps create uniform and reliable data.
Skilled and accountable staff play a key role in maintaining data integrity. Regular audits and capacity-building programs, similar to those in the banking sector, strengthen data management and workforce motivation. Leadership support, such as making forecasting a key performance indicator, ensures long-term improvements.
A case study from Werk-Brau shows that using a centralized data platform like Microsoft Dynamics 365 can reduce manual data handling by over 75%. This change streamlines inventory management and improves access to accurate data for decision-making.
Accurate, complete, and timely data improves forecasting quality.
End-to-end data visibility ensures consistency across supply chain levels.
Standardized tools and training programs enhance data reliability and accountability.
Balancing Over- and Under-Forecasting Risks
Managing the risks of over-forecasting and under-forecasting requires a structured approach. Quantitative risk analysis methods, such as Value at Risk (VaR), Monte Carlo simulation, and stress testing, help organizations measure potential losses and risk exposure. Scenario planning allows teams to develop different possible futures and assess their impact on financial performance.
Statistical methods like standard deviation and prediction intervals measure the uncertainty in forecasts. Monte Carlo simulations generate thousands of scenarios to show a range of possible outcomes. Volatility models and backtesting analyze historical data to assess forecast accuracy.
Assigning probabilities and impact levels to each scenario helps prioritize risks and manage trade-offs. Continuous monitoring and expert judgment allow teams to adapt quickly as market conditions change.
Quantitative risk analysis measures potential losses.
Scenario planning and simulations prepare organizations for a range of outcomes.
Continuous monitoring keeps forecasts relevant and accurate.
Achieving Cross-Departmental Alignment
Effective forecasting depends on strong collaboration between departments. Sales, operations, finance, and supply chain teams must share information and align their goals. Regular meetings and clear communication channels help break down silos.
Leadership support encourages departments to treat forecasting as a shared responsibility. Training programs and shared performance metrics promote accountability and teamwork.
When all departments work together, organizations respond faster to demand changes and improve overall forecast accuracy.
Cross-functional teams share data and insights.
Regular communication builds trust and alignment.
Shared goals and metrics drive collective success.
Actionable Steps for Adopting 7-Day Order Forecast
Best Practices for Implementation
Enterprises achieve success by following proven steps when adopting short-term forecasting. Leaders start by setting clear goals for inventory, service levels, and cost savings. They select a cross-functional team with members from sales, operations, and IT. This team reviews current processes and identifies gaps in data collection and technology.
A phased rollout works best. Teams begin with a pilot program in one region or product line. They use this pilot to test forecasting models and measure results. Feedback from the pilot helps refine the process before scaling up.
Tip: Leaders should invest in training for staff. Well-trained employees use forecasting tools more effectively and spot errors early.
A simple checklist for implementation:
Define measurable objectives.
Build a cross-functional team.
Audit current data and systems.
Launch a pilot program.
Train staff on new tools.
Review pilot results and adjust.
Expand to other areas.
Tips for Continuous Improvement and Scaling
Continuous improvement ensures forecasting stays accurate as business needs change. Teams should review forecast accuracy every week. They compare predicted and actual results, then update models as needed.
Automation helps scale the process. Enterprises use dashboards to monitor performance and spot trends. Regular meetings keep all departments aligned and focused on shared goals.
A table of improvement actions:
Action | Benefit |
|---|---|
Weekly accuracy checks | Early error detection |
Model updates | Adapts to new demand patterns |
Staff feedback | Identifies process gaps |
Dashboard monitoring | Real-time performance tracking |
Note: Enterprises that celebrate small wins build momentum for larger changes.
Scaling works best when leaders share success stories and lessons learned. This approach encourages buy-in across the organization and supports long-term adoption.
Enterprises gain real results by adopting a structured, data-driven approach. Teams see fewer stockouts, lower costs, and better use of resources. Leaders who start with pilot programs can measure outcomes and build on success.
Strong data practices support long-term growth
Clear goals and teamwork drive improvement
Companies that act now can stay ahead in a changing market.
FAQ
What is a 7-Day Order Forecast?
A 7-Day Order Forecast predicts customer demand for the next week. Enterprises use this forecast to plan inventory, manage resources, and reduce costs. Accurate short-term forecasting helps companies respond quickly to market changes.
How does a 7-Day Order Forecast reduce stockouts?
The forecast uses real-time data to identify products at risk of running out. Teams can reorder these items before shortages occur.
This proactive approach keeps shelves stocked and customers satisfied.
Which industries benefit most from 7-Day Order Forecasting?
Industries with fast-moving inventory see the greatest gains.
Retail
Manufacturing
Distribution
These sectors use short-term forecasts to optimize supply chains and improve service levels.
What technology supports 7-Day Order Forecasting?
Enterprises use advanced analytics, machine learning, and automated ordering systems.
Technology | Benefit |
|---|---|
Machine Learning | Improves accuracy |
Automation | Speeds up ordering |
Dashboards | Tracks performance |
How can companies start using a 7-Day Order Forecast?
Companies should begin with a pilot program. They select a product line or region, gather data, and test forecasting models.
Early results guide improvements before expanding to other areas.
See Also
Effective Weekly Retail Demand Prediction Techniques And Tips
Key Approaches And Challenges In Short-Term Demand Forecasting
Integrating Price Sensitivity And Calendar Impact In Weekly Forecasts
Improving Inventory Turnover While Avoiding Stockouts Strategies
Creating A Data-Focused Stage-Gate Process For Retail Launches
