Visual Analysis of Singdata Data with RATH
1. Introduction to RATH
RATH is not only a powerful open-source data analysis and visualization tool comparable to well-known tools like Tableau, but it also automates exploratory data analysis workflows by automatically discovering data patterns, insights, and causal relationships through its enhanced analysis engine. RATH can easily achieve dimensional data visualization.
Main features include:
-
🤖 Automated Data Insights: Get data insights with one click! The enhanced analysis engine helps you discover patterns, insights, and causal relationships in the data. This is a fully automated way to explore and visualize datasets with just one click.
-
🛠 Data Exploration Co-pilot: RATH will act as your data science assistant, understanding your intentions and generating relevant suggestions.
-
Natural Language Interface: Ask questions in natural language to get answers and visualizations from the data.
-
AutoVis: RATH generates the best visualizations for the data you select. This allows you to focus on the data and variables without worrying about how to visualize them.
-
👓 Data Manager: An automatic data manager that generates summaries of data and data transformations.
-
🎨 Data Drawing Tool: An interactive, intuitive, and powerful tool for exploratory data analysis by directly coloring the data and having further analysis capabilities. Watch this video to learn how to use the data drawing tool to discover data insights.
-
📊 Dashboard: Build a beautiful interactive data dashboard (including an automated dashboard designer that can provide suggestions for your dashboard).
-
Causal Analysis: Identify and examine causal relationships between variables, which can help you explore data, create better predictive models, and make informed business decisions.
2. Environment Preparation
-
Clone the source code to your local machine:
-
Enter the directory where Rath is located.
-
Start the Docker container:
-
Open the browser and visit: http://localhost:9083.
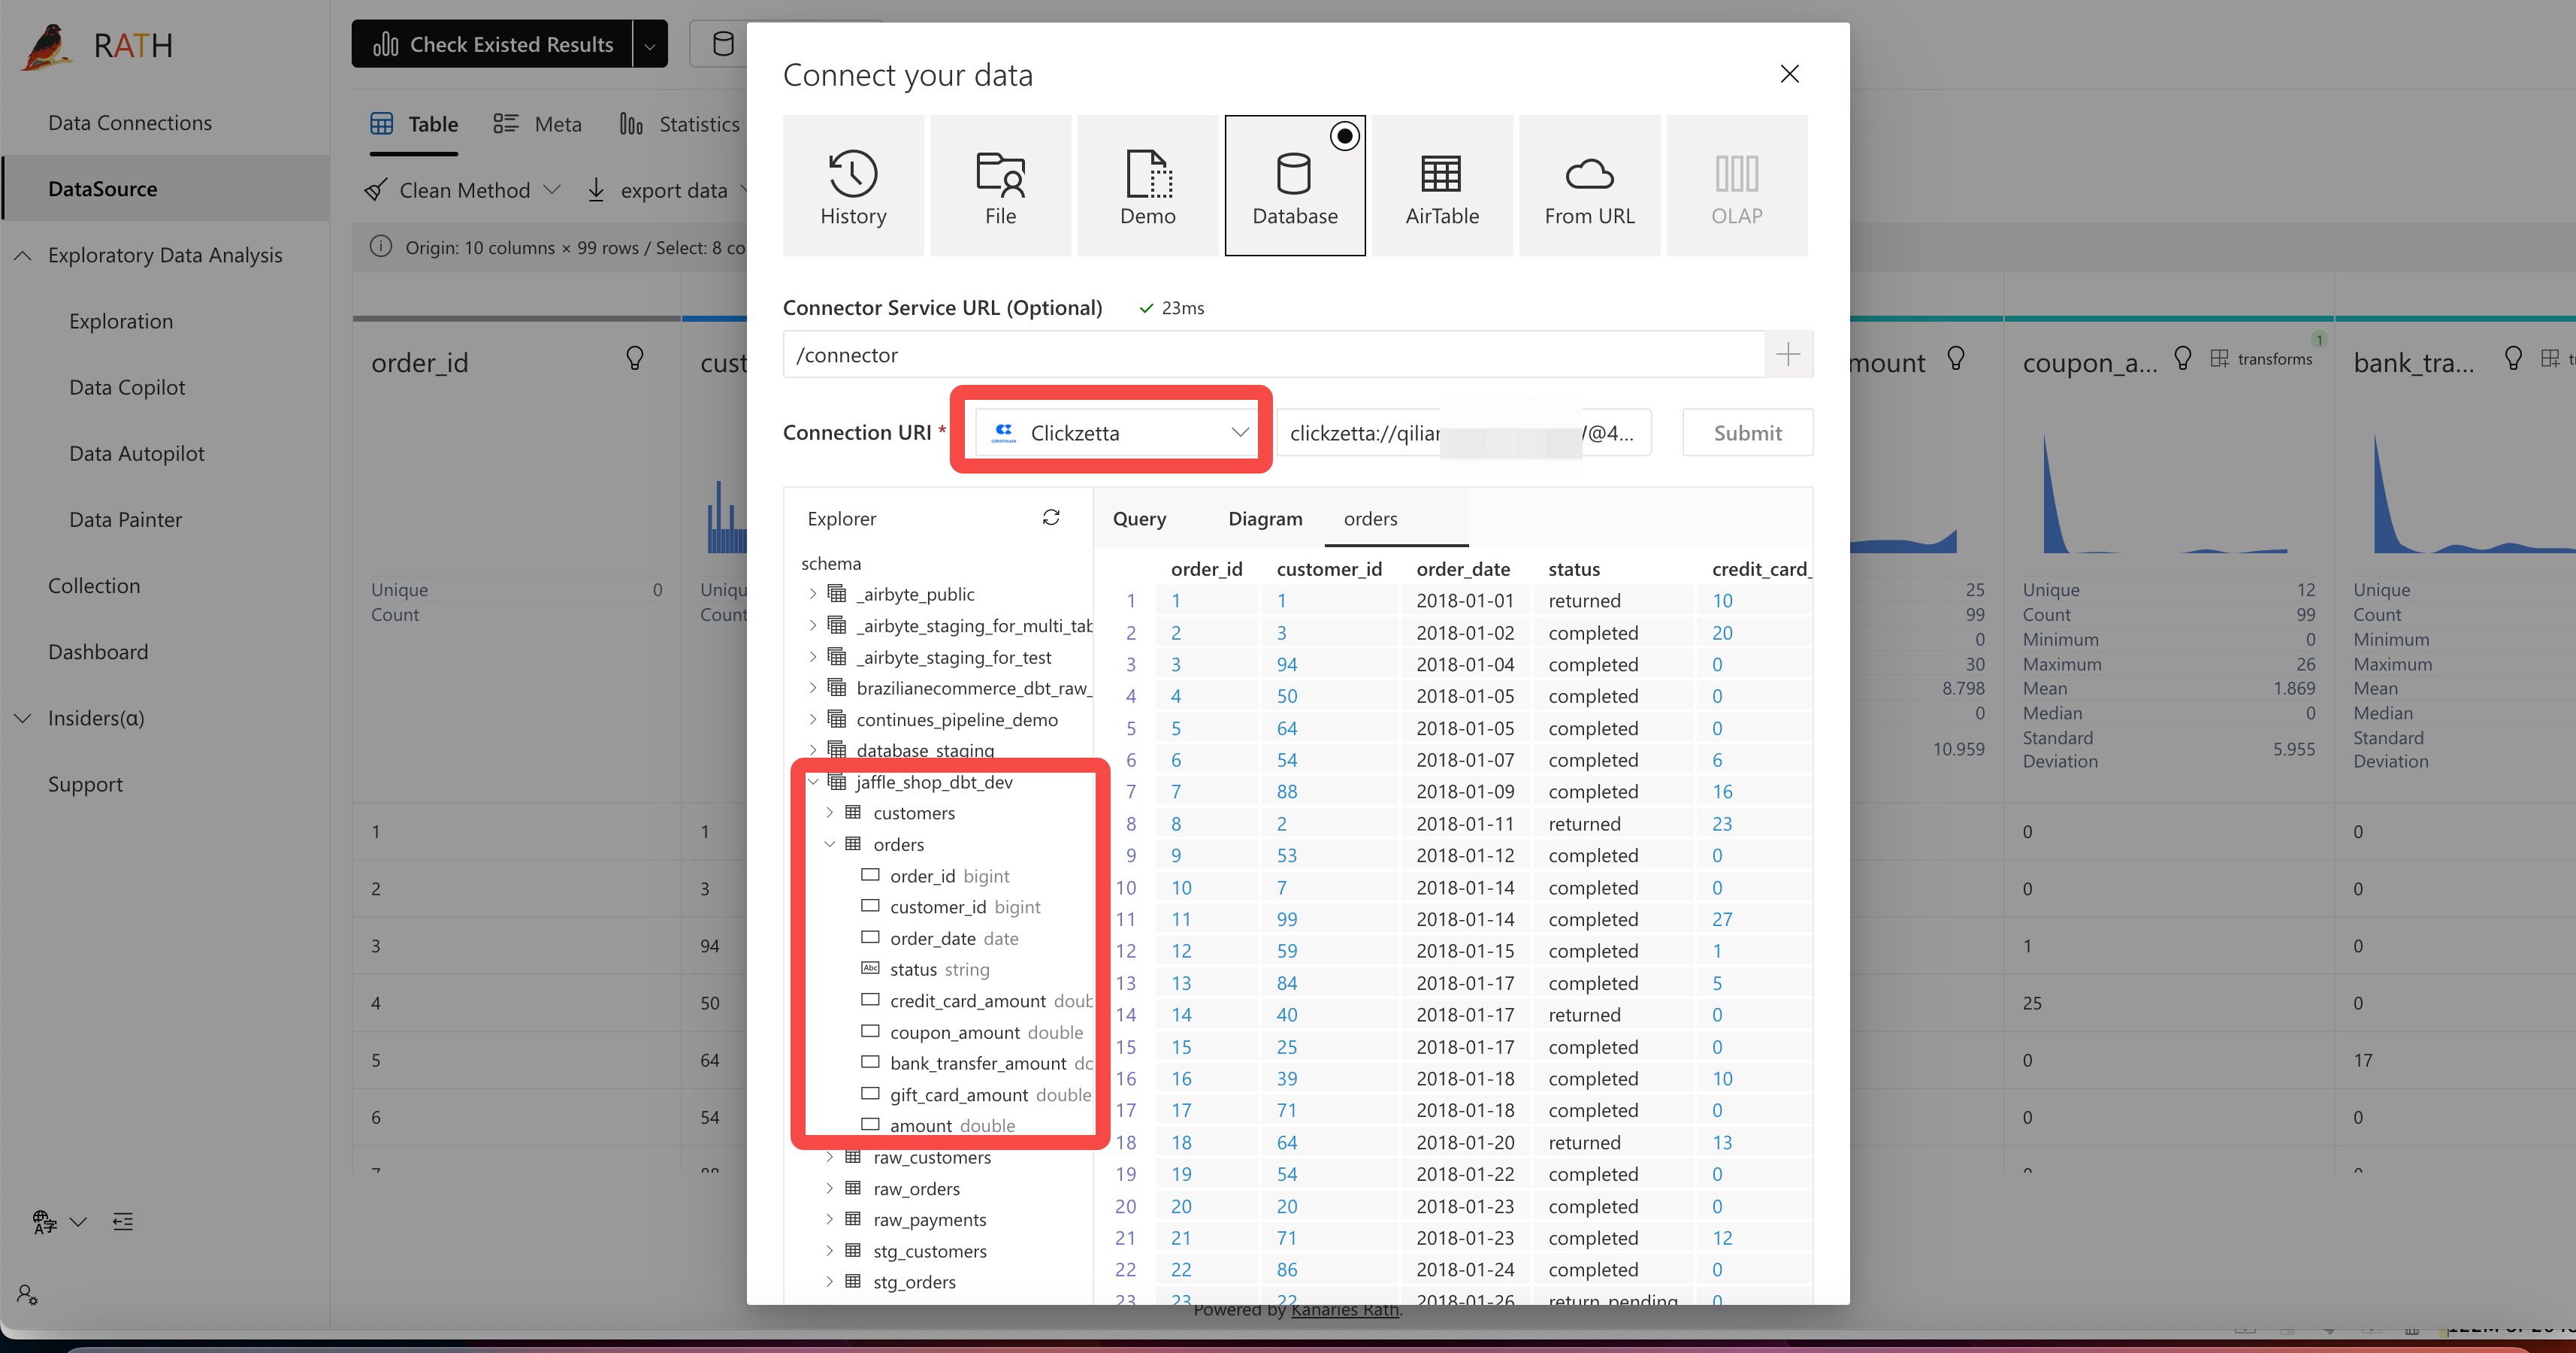
3. Import Data from Singdata Lakehouse
-
Select Connection type as Singdata.
-
Fill in the connection string in the following format:
4. View Data Archives
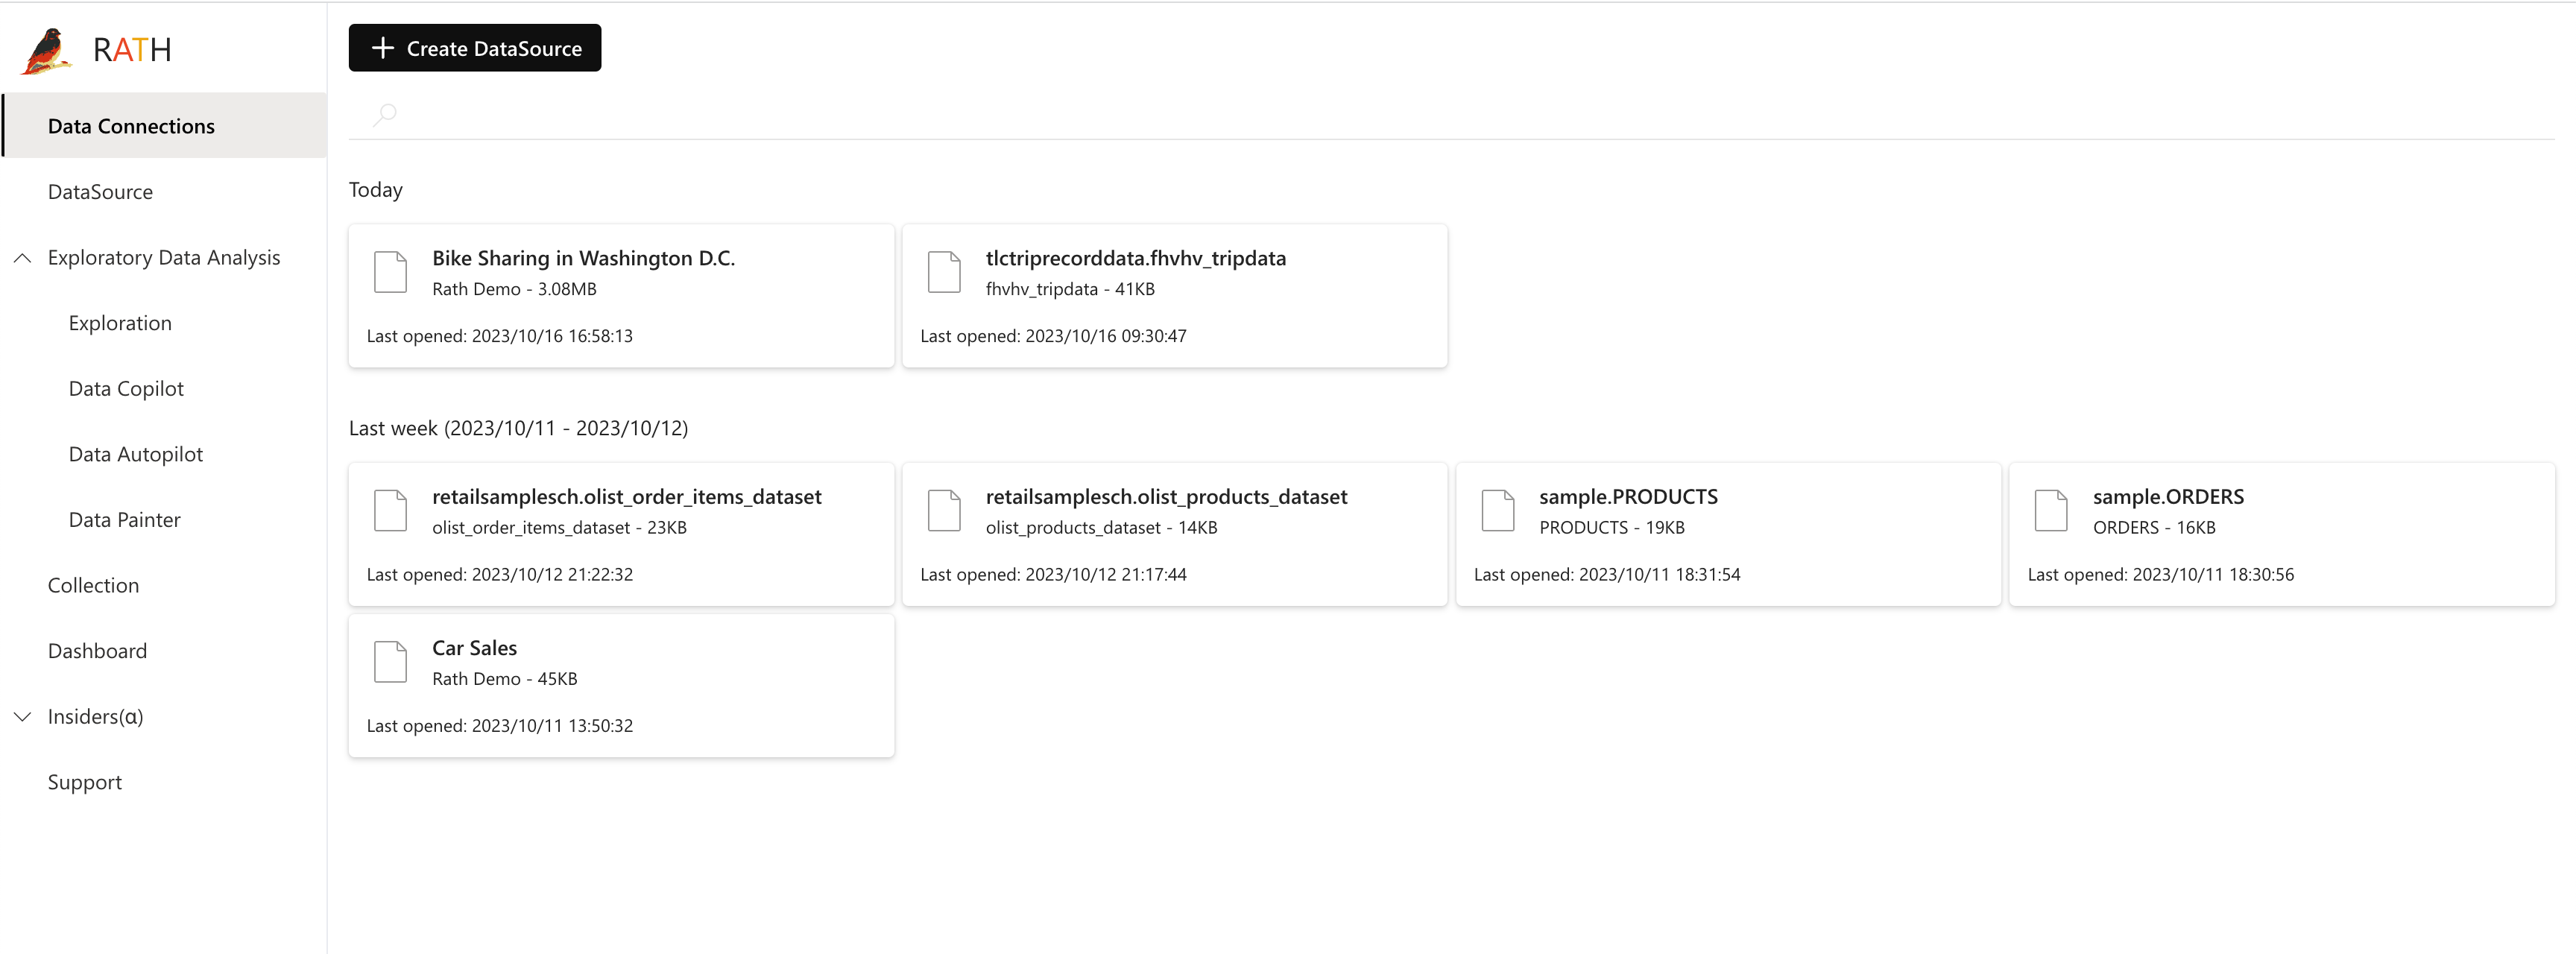
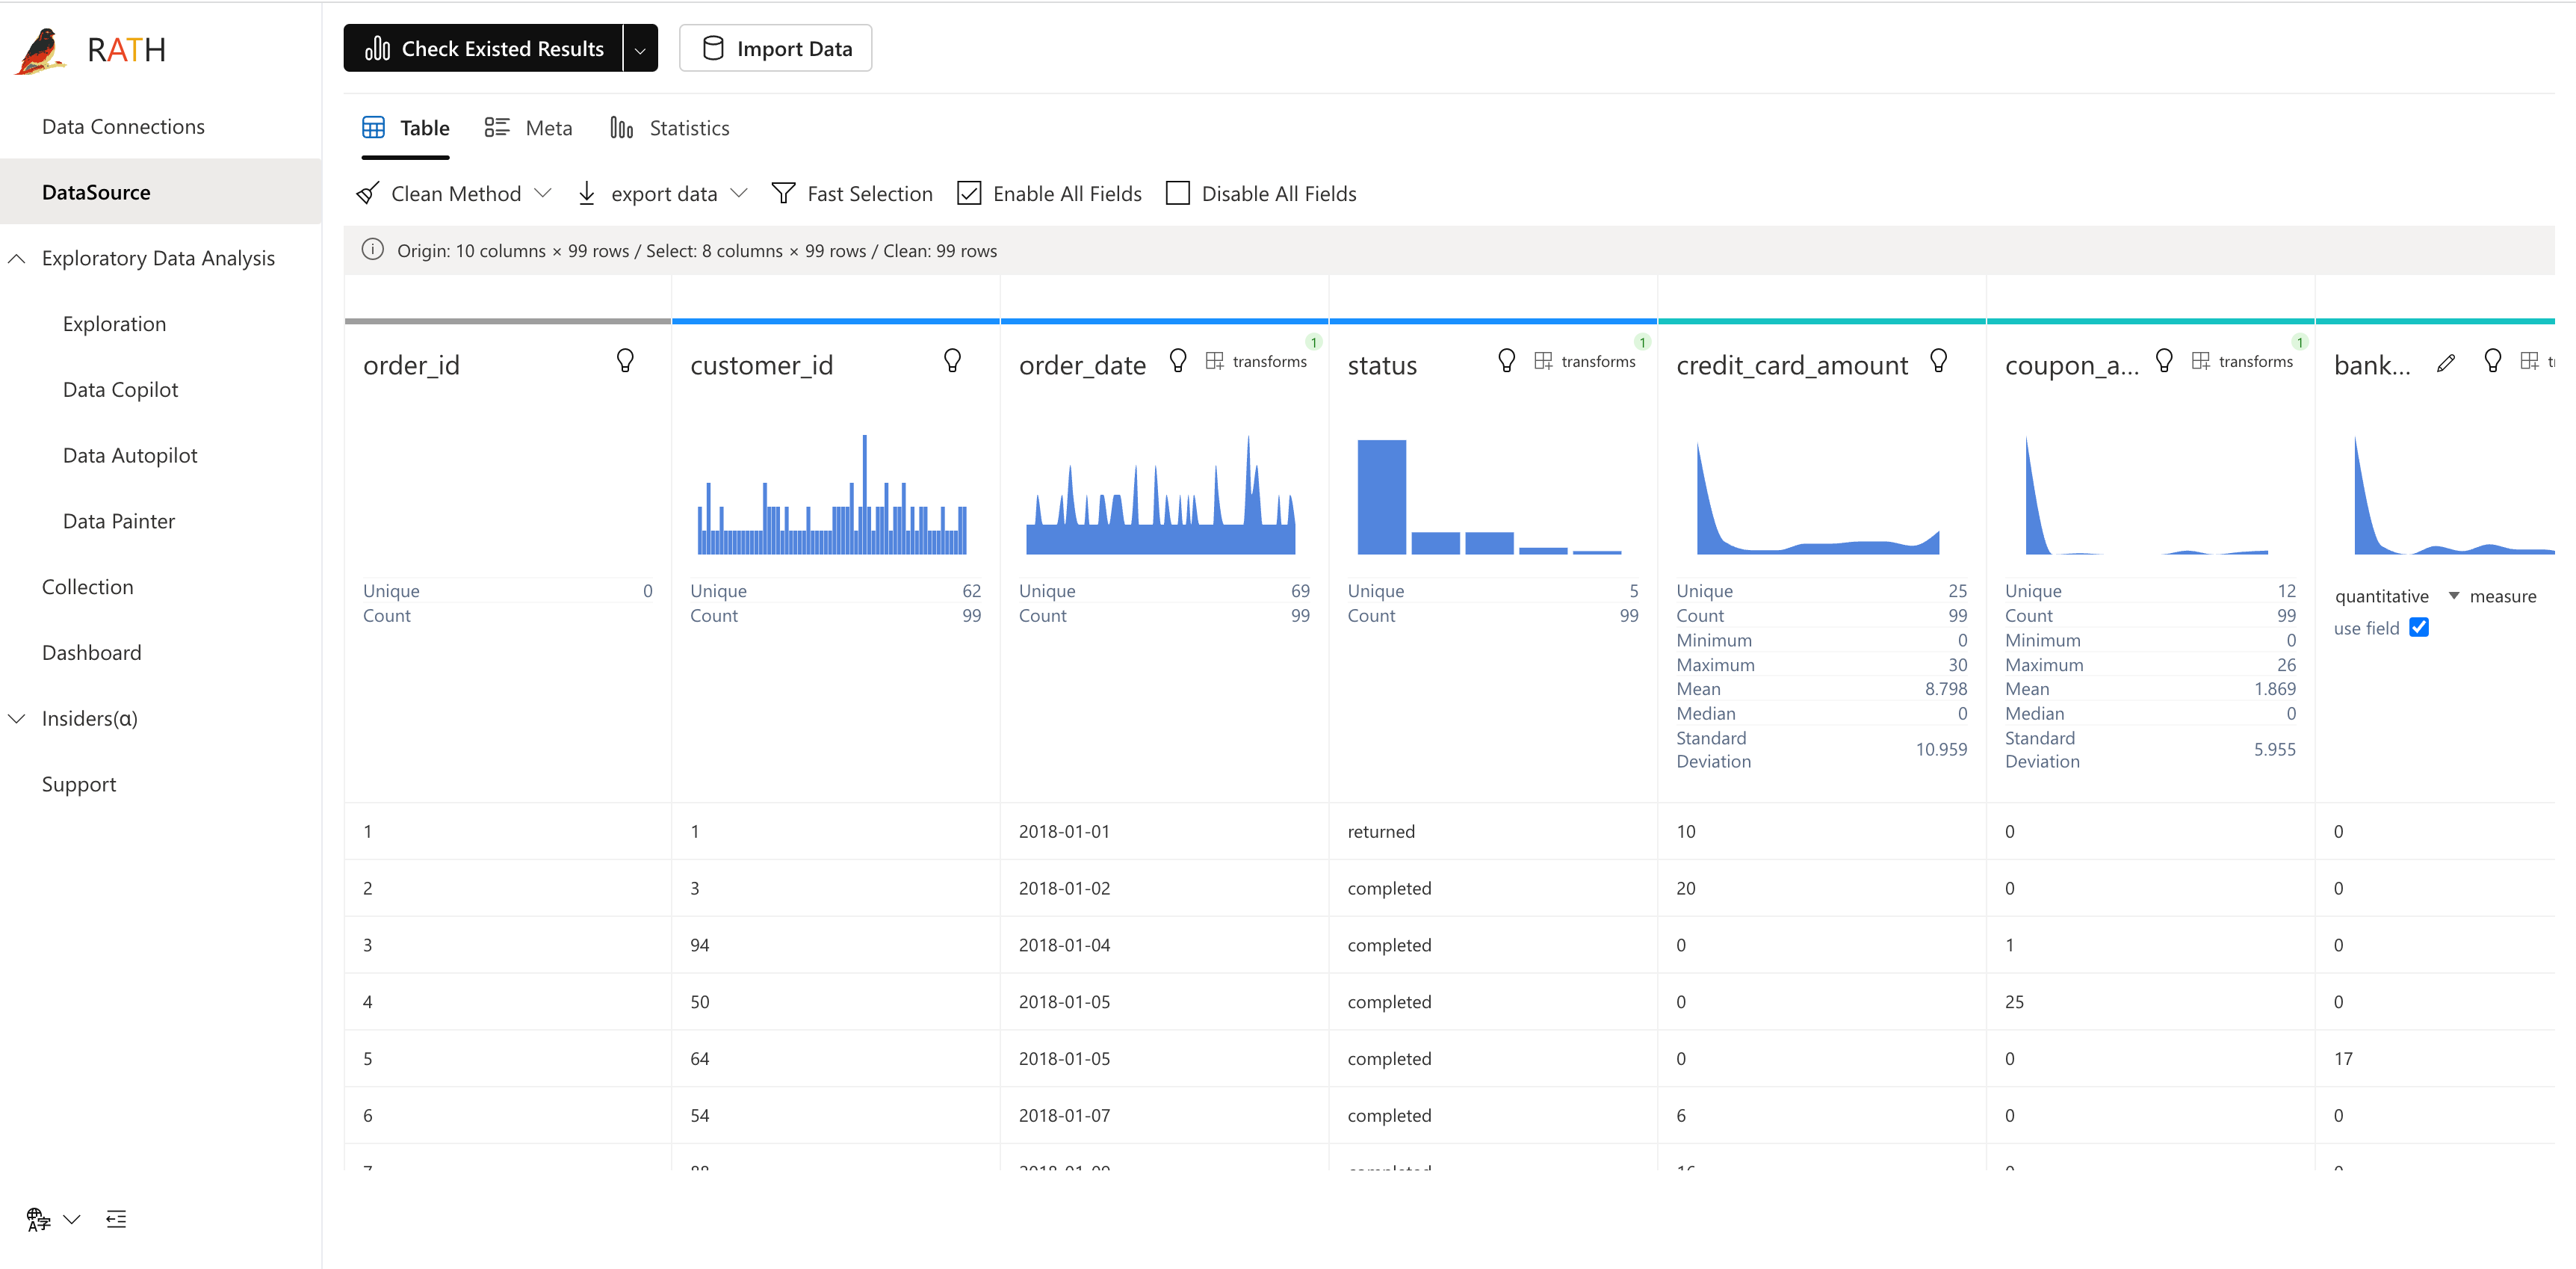
In RATH, you can view data archives to understand the structure and content of datasets. Click on the "Data Archives" option in the left navigation bar, and you will see a list of all imported datasets.
5. Perform Visual Analysis
In RATH, you can easily create various types of visual charts to analyze data. Here are some usage examples:
-
Example 1: Create a bar chart to show sales by different categories.
- Click the "New Analysis" button.
- Select the sales and category fields from the dataset.
- Choose bar chart as the visualization type.
- Drag and drop fields to the respective axis and value areas.
- Adjust the chart style and colors.
-
Example 2: Create a line chart to show the trend of sales over time.
- Click the "New Analysis" button.
- Select the sales and date fields from the dataset.
- Choose line chart as the visualization type.
- Drag and drop fields to the respective axis and value areas.
- Adjust the chart style and colors.
-
Example 3: Create a scatter plot to show the relationship between two variables.
- Click the "New Analysis" button.
- Select the two fields to be analyzed from the dataset.
- Choose scatter plot as the visualization type.
- Drag and drop fields to the respective axis and value areas.
- Adjust the chart style and colors.
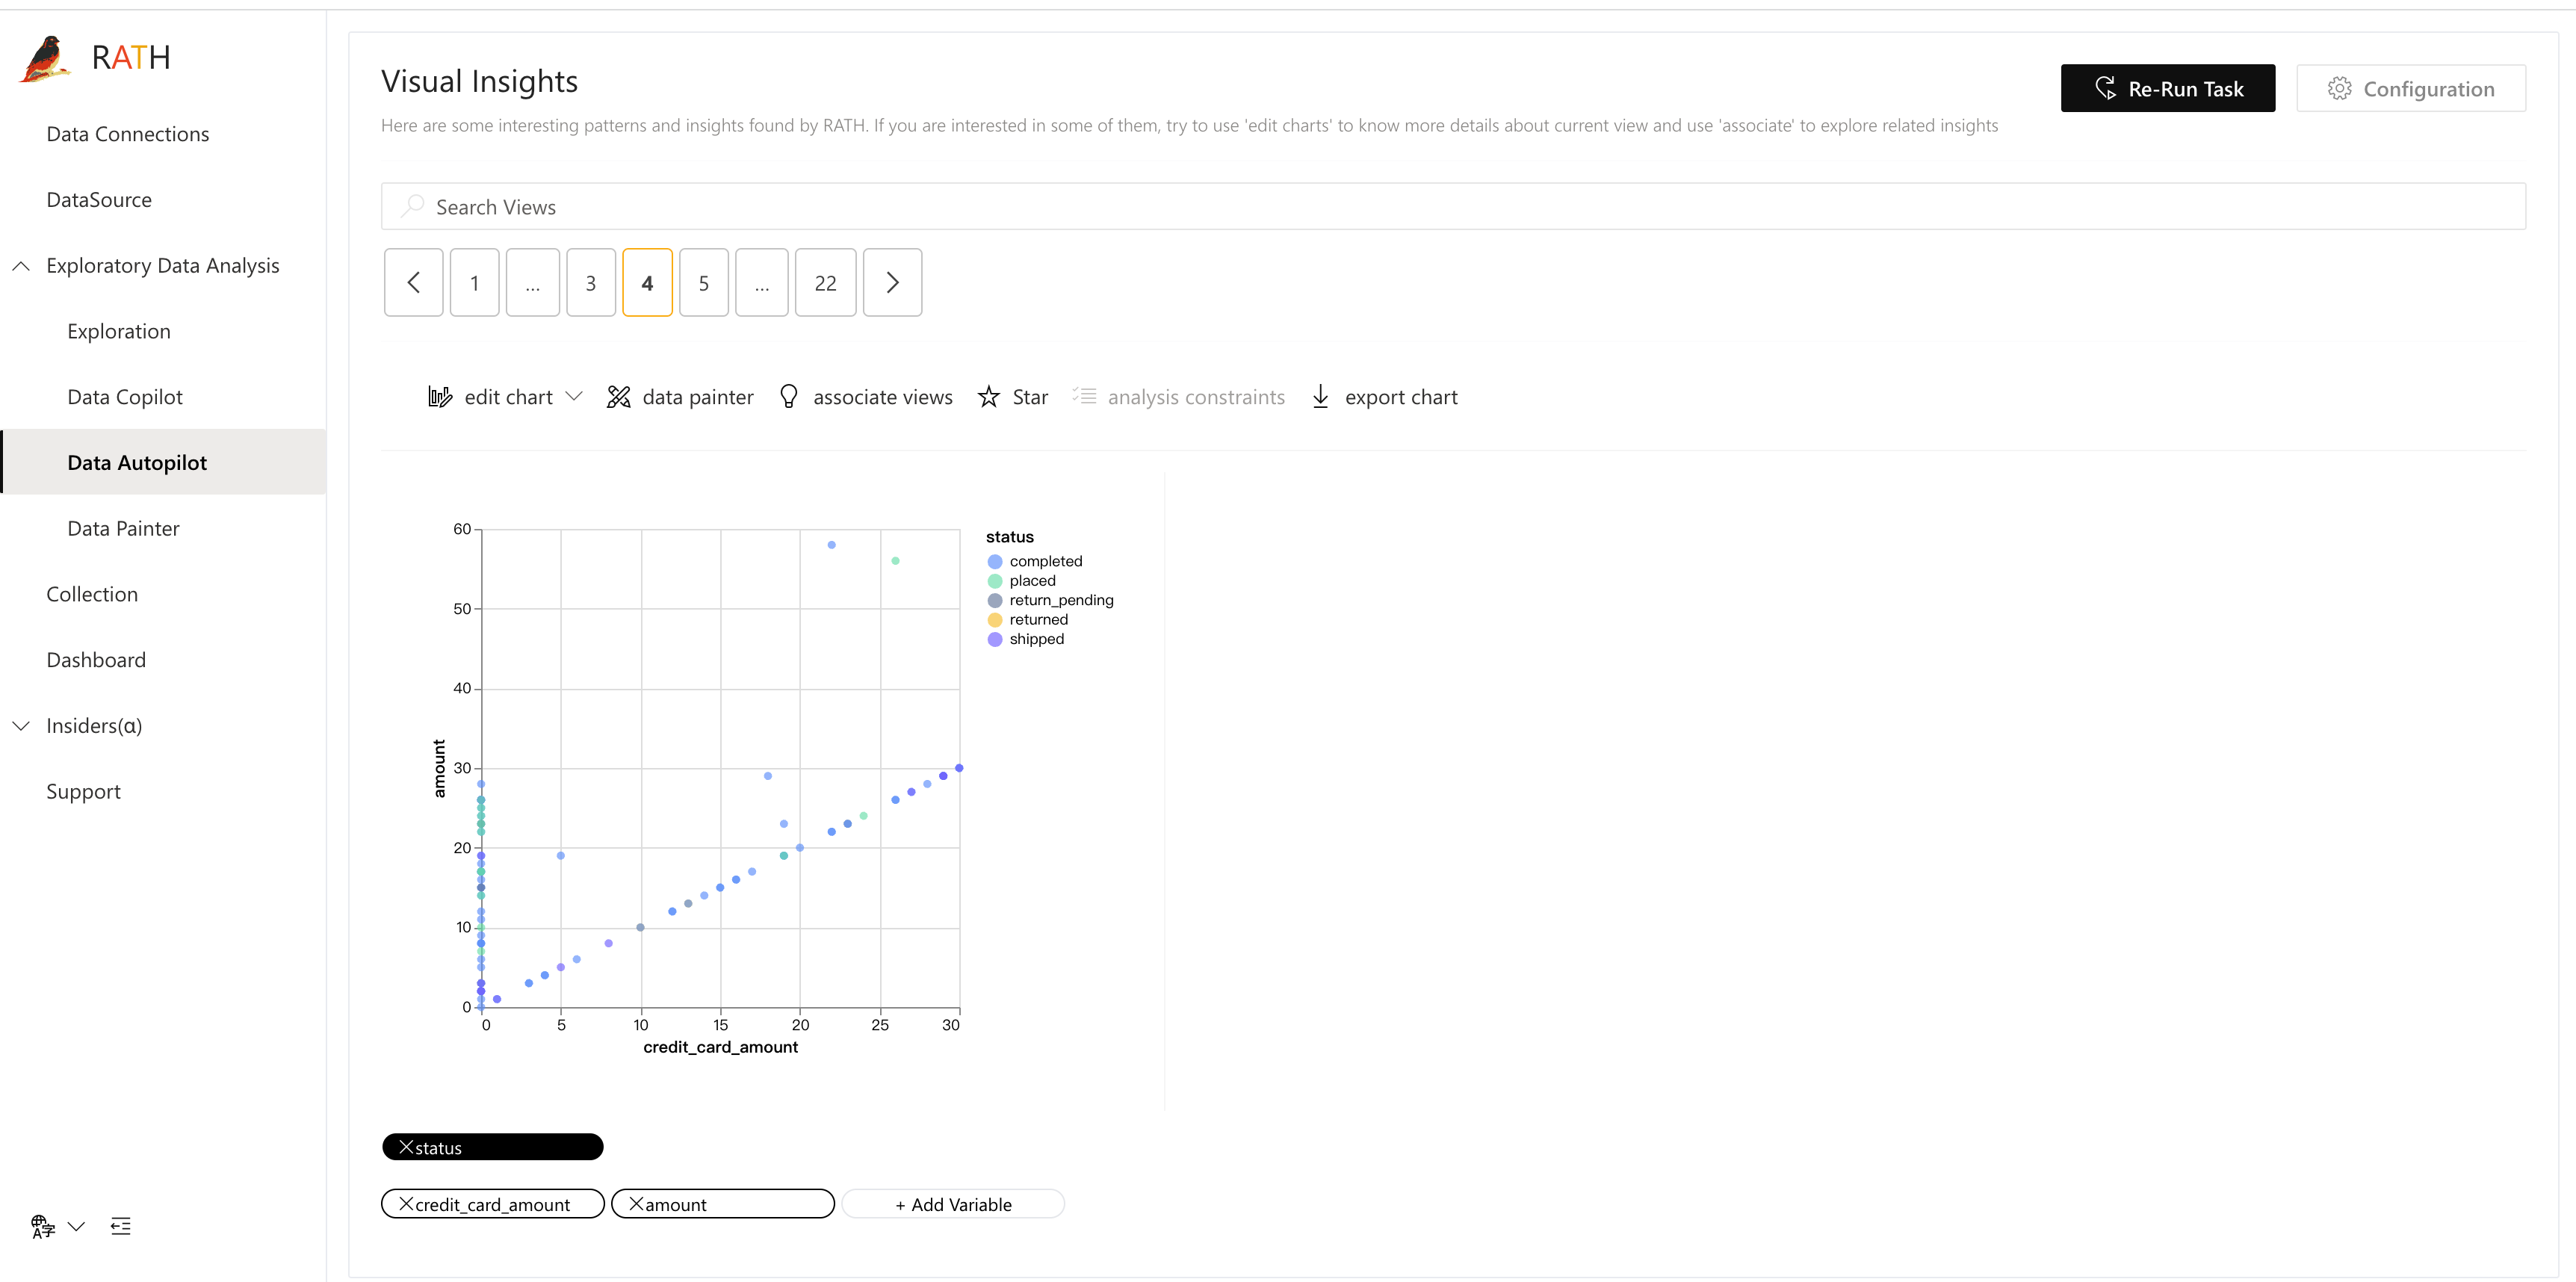
Through the above steps, you can easily use RATH to perform visual analysis on Singdata data. Whether discovering patterns, insights, or causal relationships in the data, RATH provides you with powerful support.