DataOps Data Security and Stable Production Practices
Overview
DataOps, by combining best practices from agile development, data management, and data science, can significantly improve the efficiency and quality of data pipelines. In the entire DataOps data development and operation pipeline, data development management and data operations are two extremely critical links.
This practice revolves around these two links, based on NYC TLC Trip Record Data, to build a pipeline for data cleaning and metric statistical analysis, producing data for BI query use. Through this practice, you can learn the following:
- How to conveniently build a scheduled data processing pipeline for unified scheduling and orchestration of data synchronization, SQL tasks, etc.
- How to use monitoring and alerting rules to promptly monitor the stability of task operations.
- How to use data quality monitoring rules to monitor the correctness of data output, promptly alert, and prevent the spread of problematic data.
- How to use comprehensive operational measures to quickly locate the cause of problems.
- How to improve the efficiency of handling monitoring alerts.
Pipeline
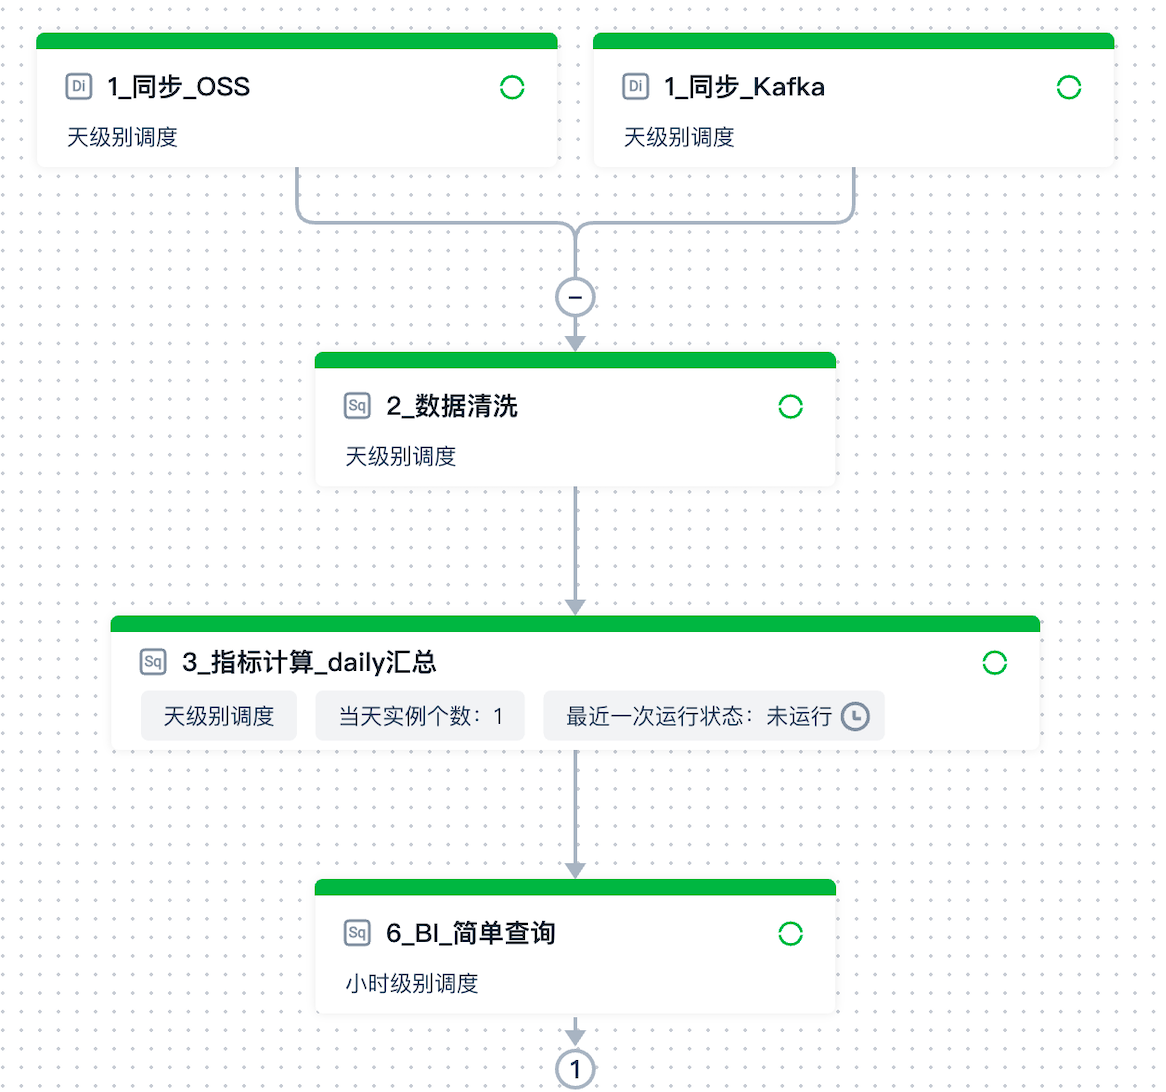
The entire pipeline includes the following five task nodes:
- 1_sync_OSS: Batch synchronize data from the OSS end and write it to the Lakehouse
- 1_sync_Kafka: Batch synchronize data from the Kafka end and write it to the Lakehouse
- 2_data_cleaning: Perform simple cleaning and processing on the data synchronized from the source end, and expand it by associating dimension tables
- 3_metric_calculation_daily_summary: Calculate key business metrics
- 6_BI_simple_query: Use SQL to simulate a simple BI query
Main Steps
Task Development Scheduling and Submission for Release
Use the Task Development module to orchestrate the entire pipeline: first, perform data synchronization import, then write SQL code for data cleaning, calculate travel data on a daily basis, compute metrics such as average order amount and average number of passengers, and finally provide data for BI report queries.
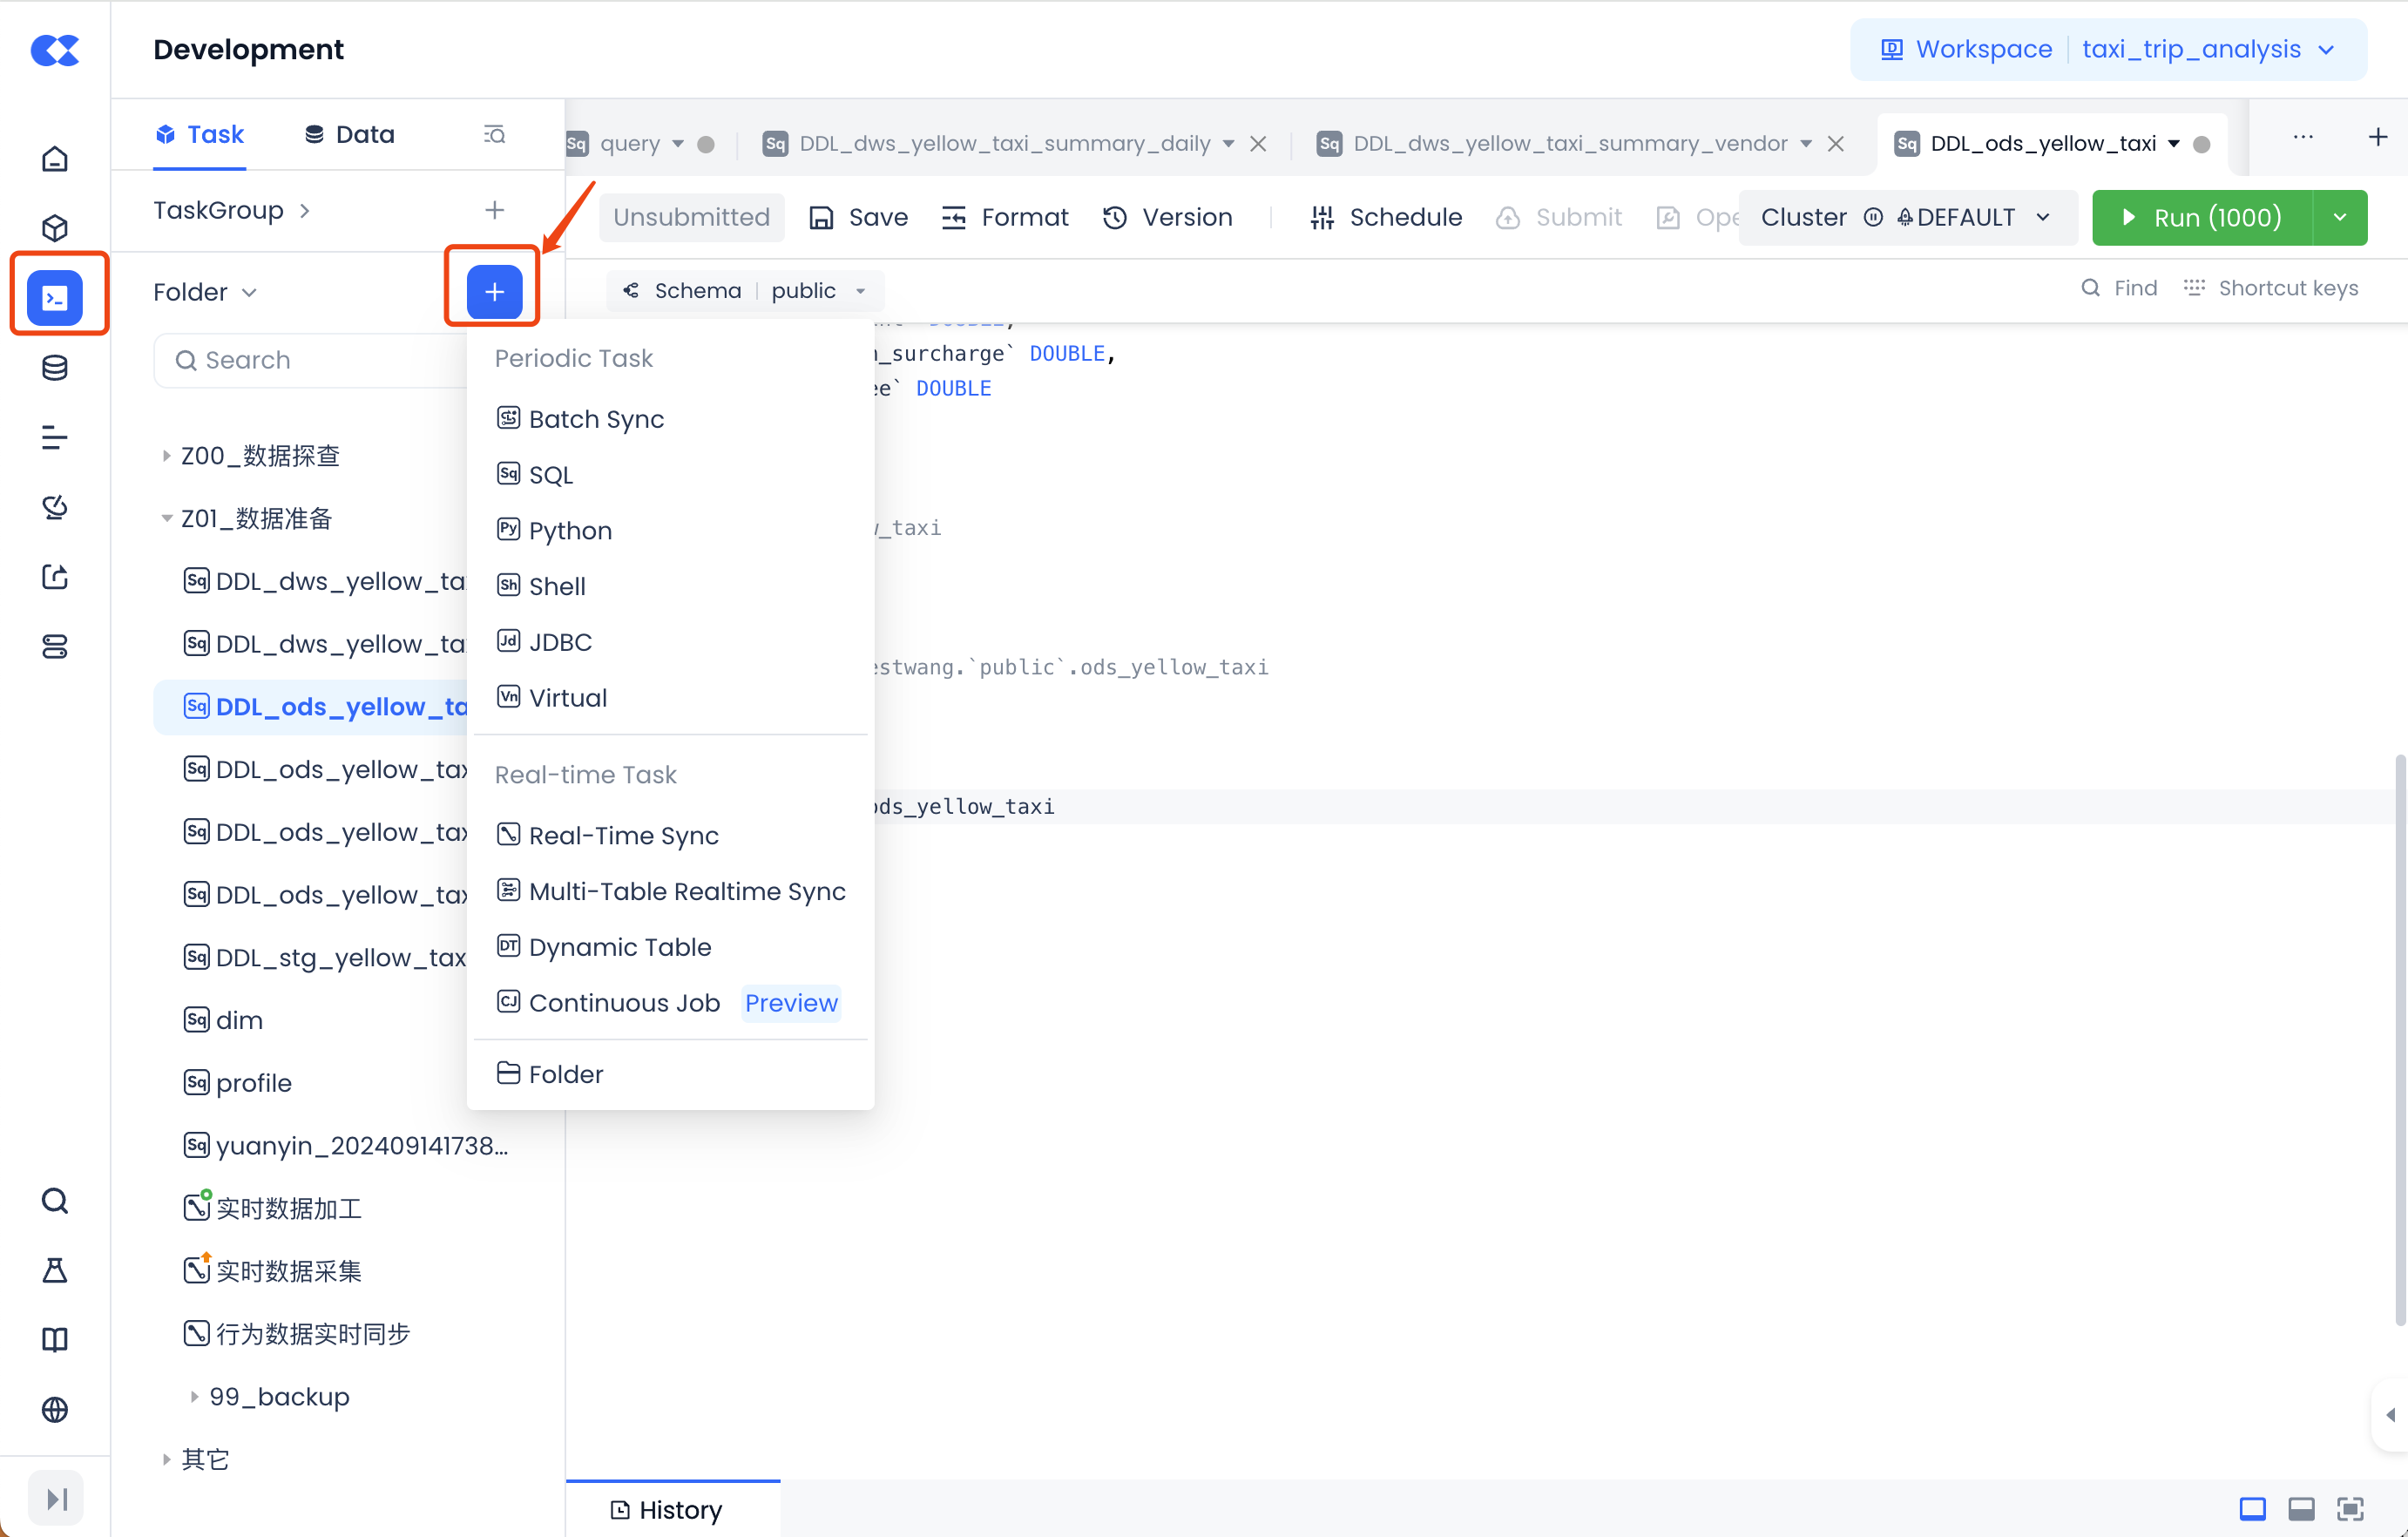
Task Development
In the task development interface, you can create synchronization tasks, SQL tasks, and other task types as needed through the new button shown in the figure below:
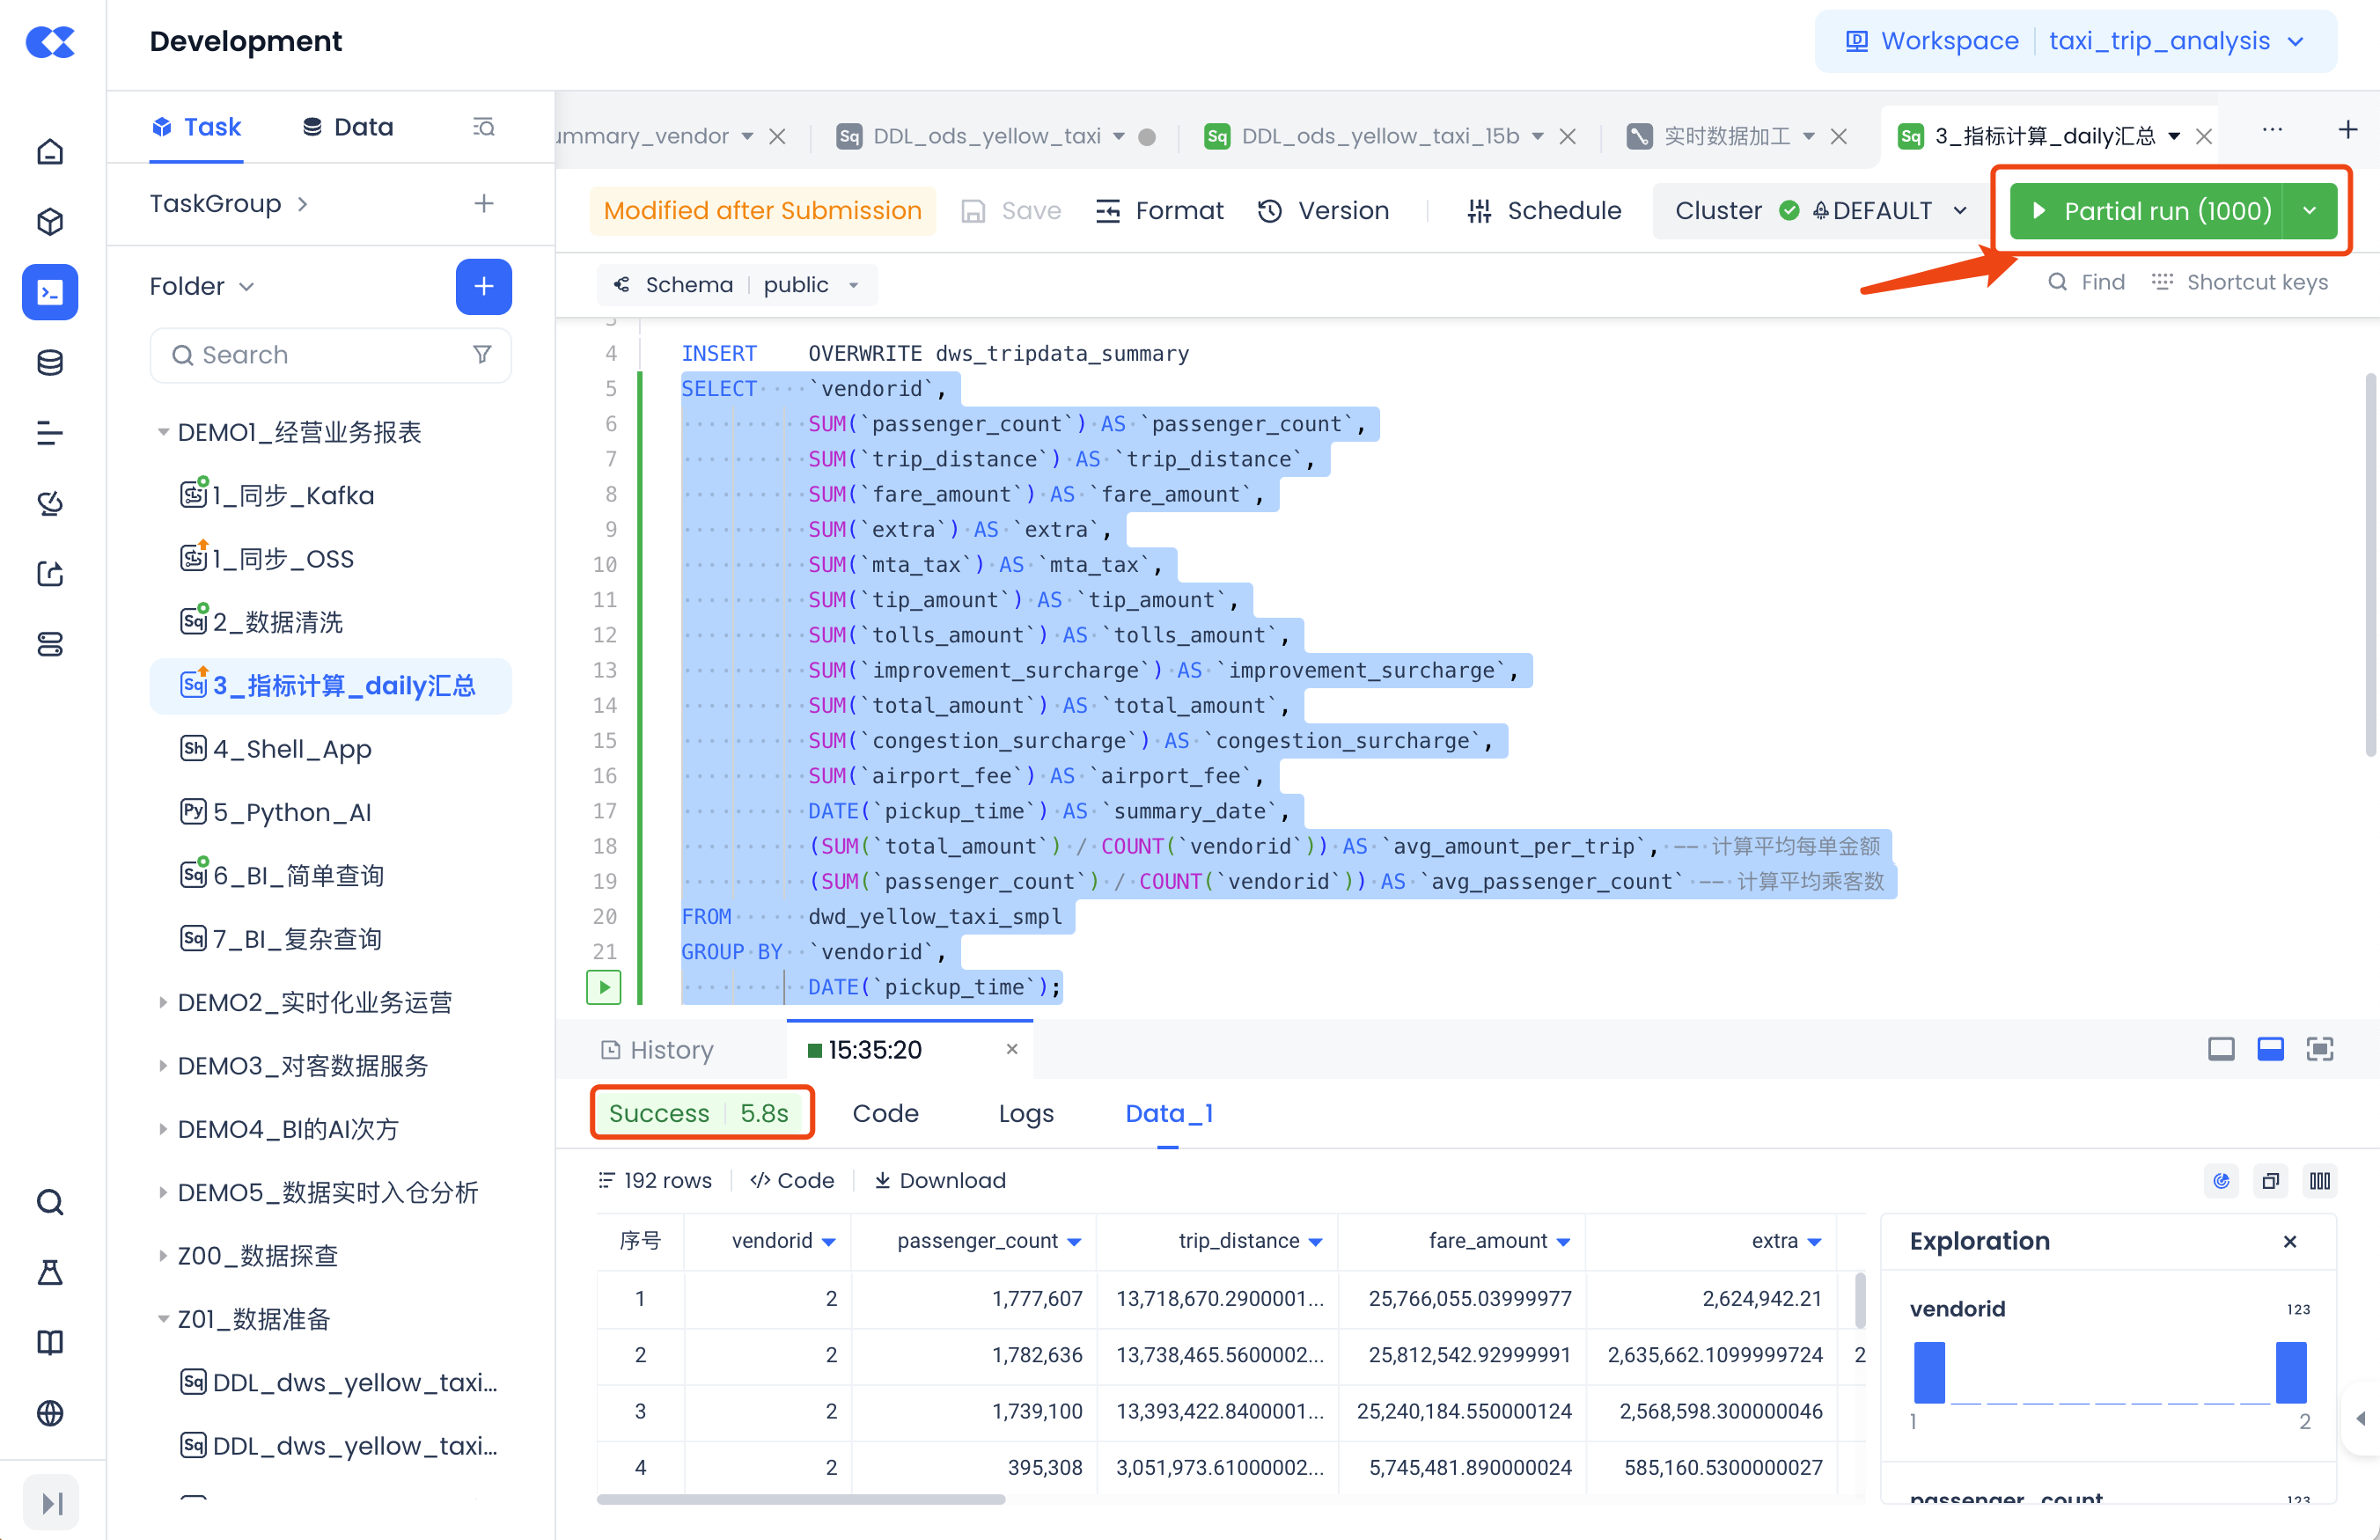
Task Debugging and Running
After creating the task, you can code and configure the task. Once these operations are completed, you can use the "Run" function to test whether the code logic is correct.
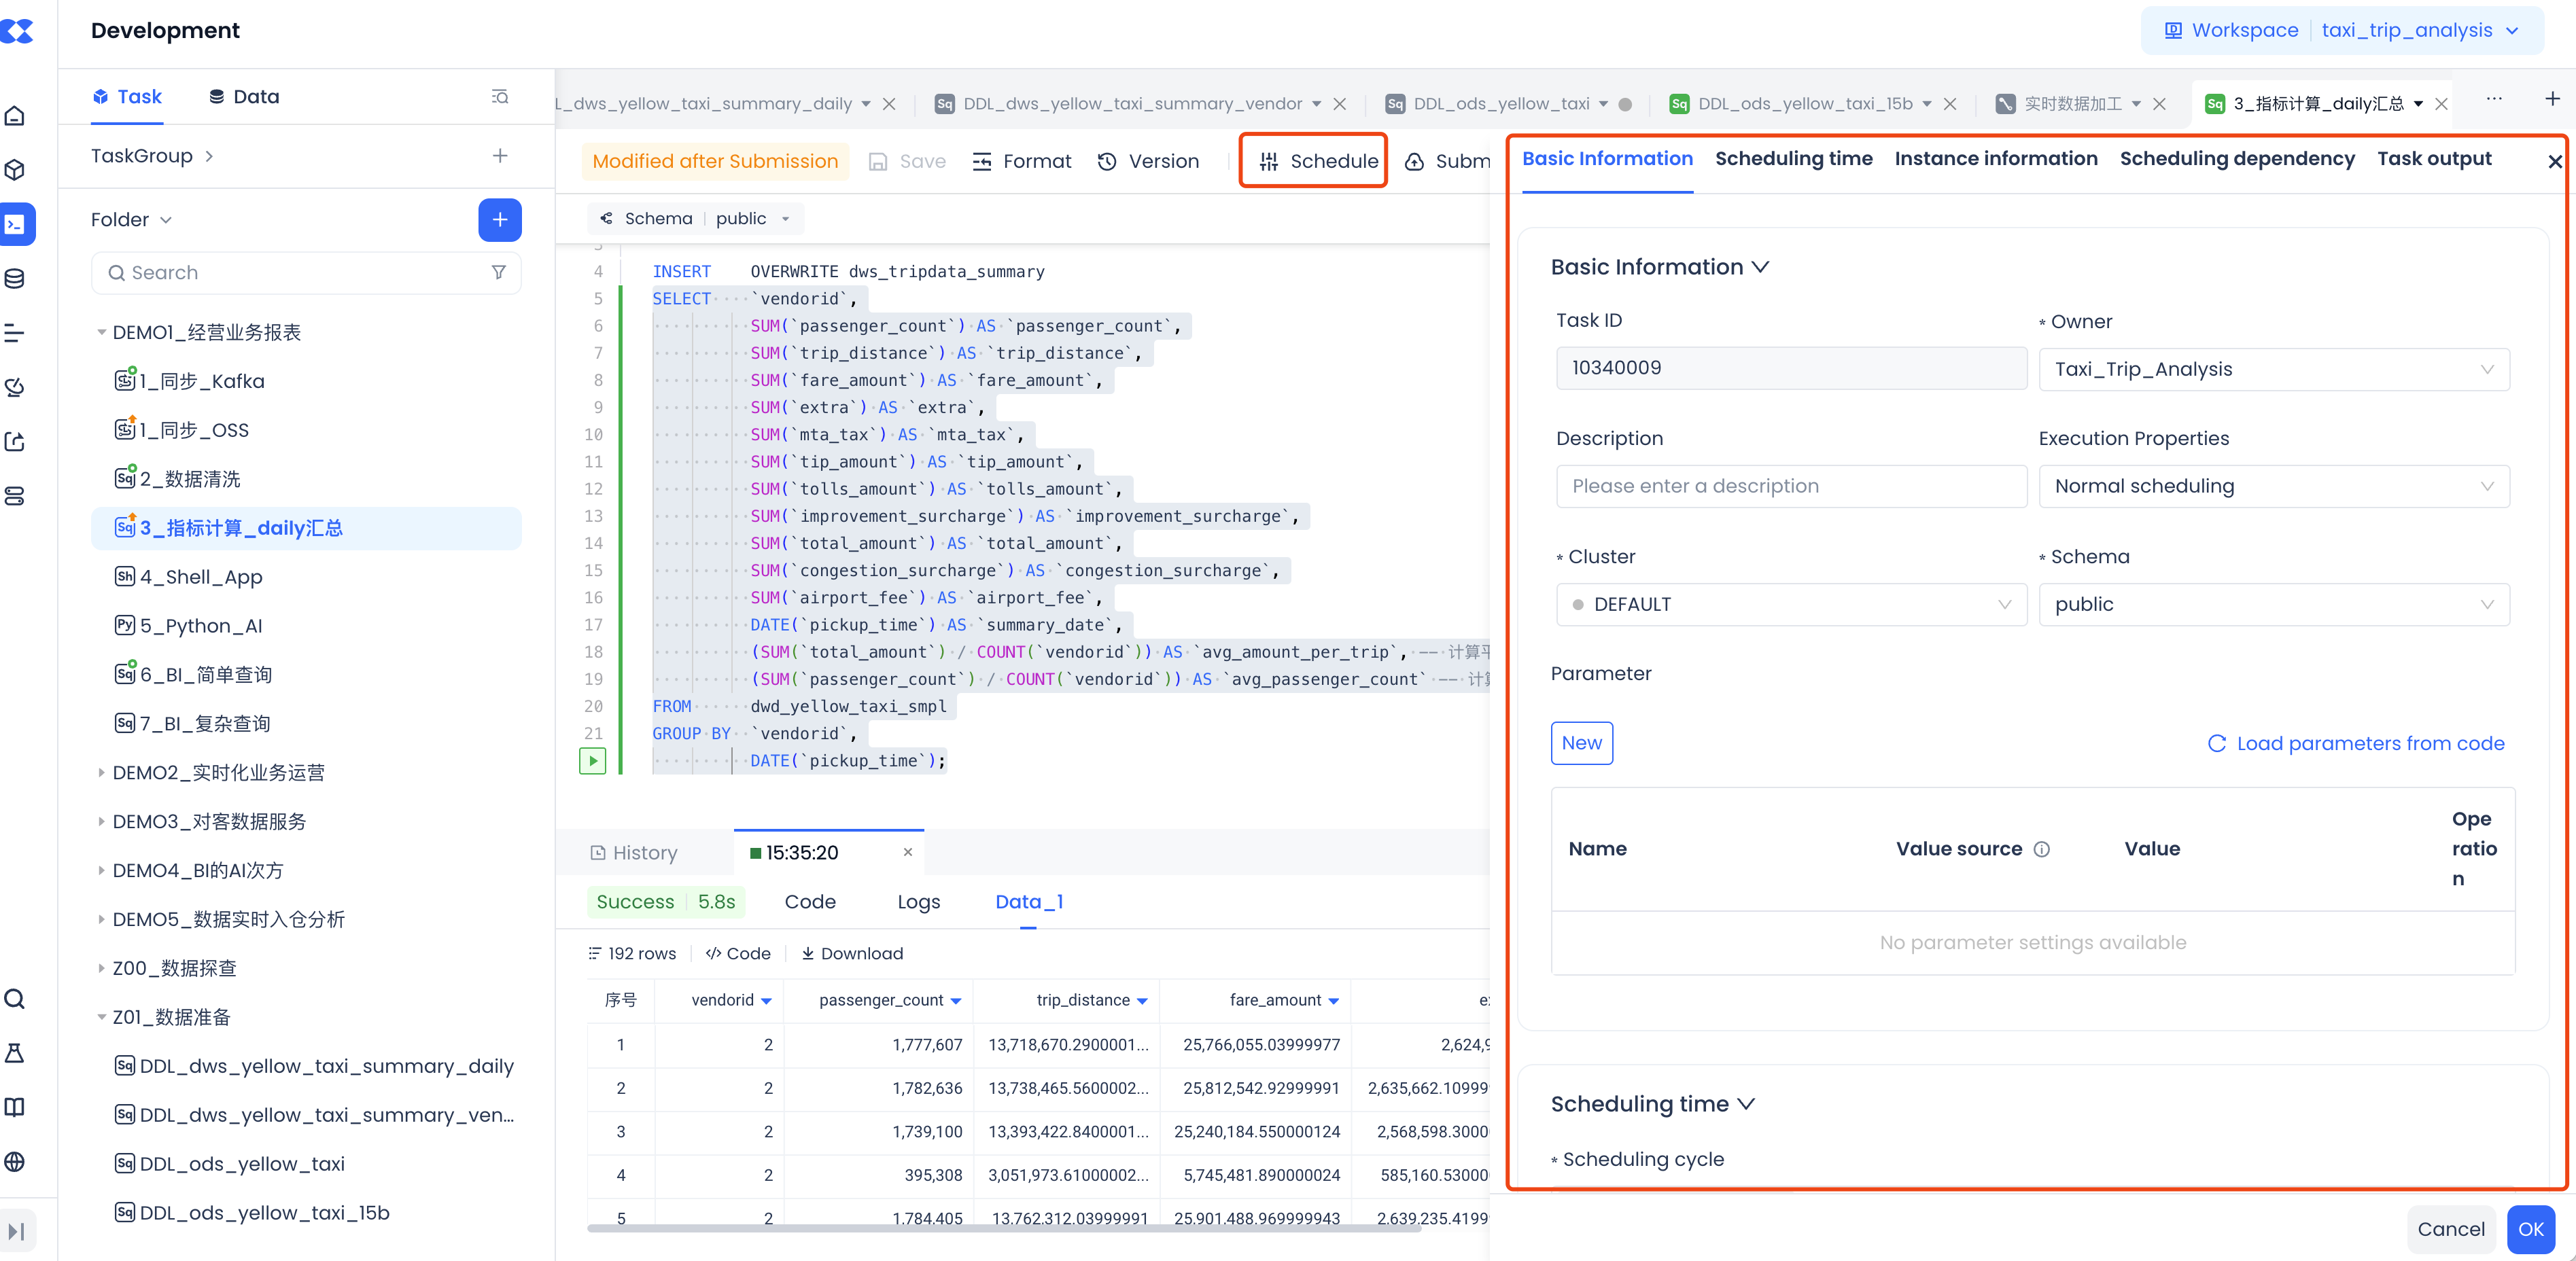
Task Scheduling Configuration and Submission for Release
After testing is completed, you can set the scheduling properties of the task in the "Configuration" option, including setting the time for scheduled scheduling, upstream dependencies of the scheduling, and other properties. Once the configuration is complete, click the "Submit" button to release the task to the production environment for regular scheduling.
Configure Monitoring and Alerts to Monitor Task Operation
After the task is released, use the Monitoring and Alerts module to configure monitoring rules to promptly monitor the status or metrics that need to be observed, such as task operation failures, and notify the responsible person through the notification channels configured in the alerts.
Monitoring Rule Configuration
Taking this example, configure the monitoring of the task instance's operation failure status, specify the task name, and configure the notification channels (based on notification policies) and personnel, as shown below:
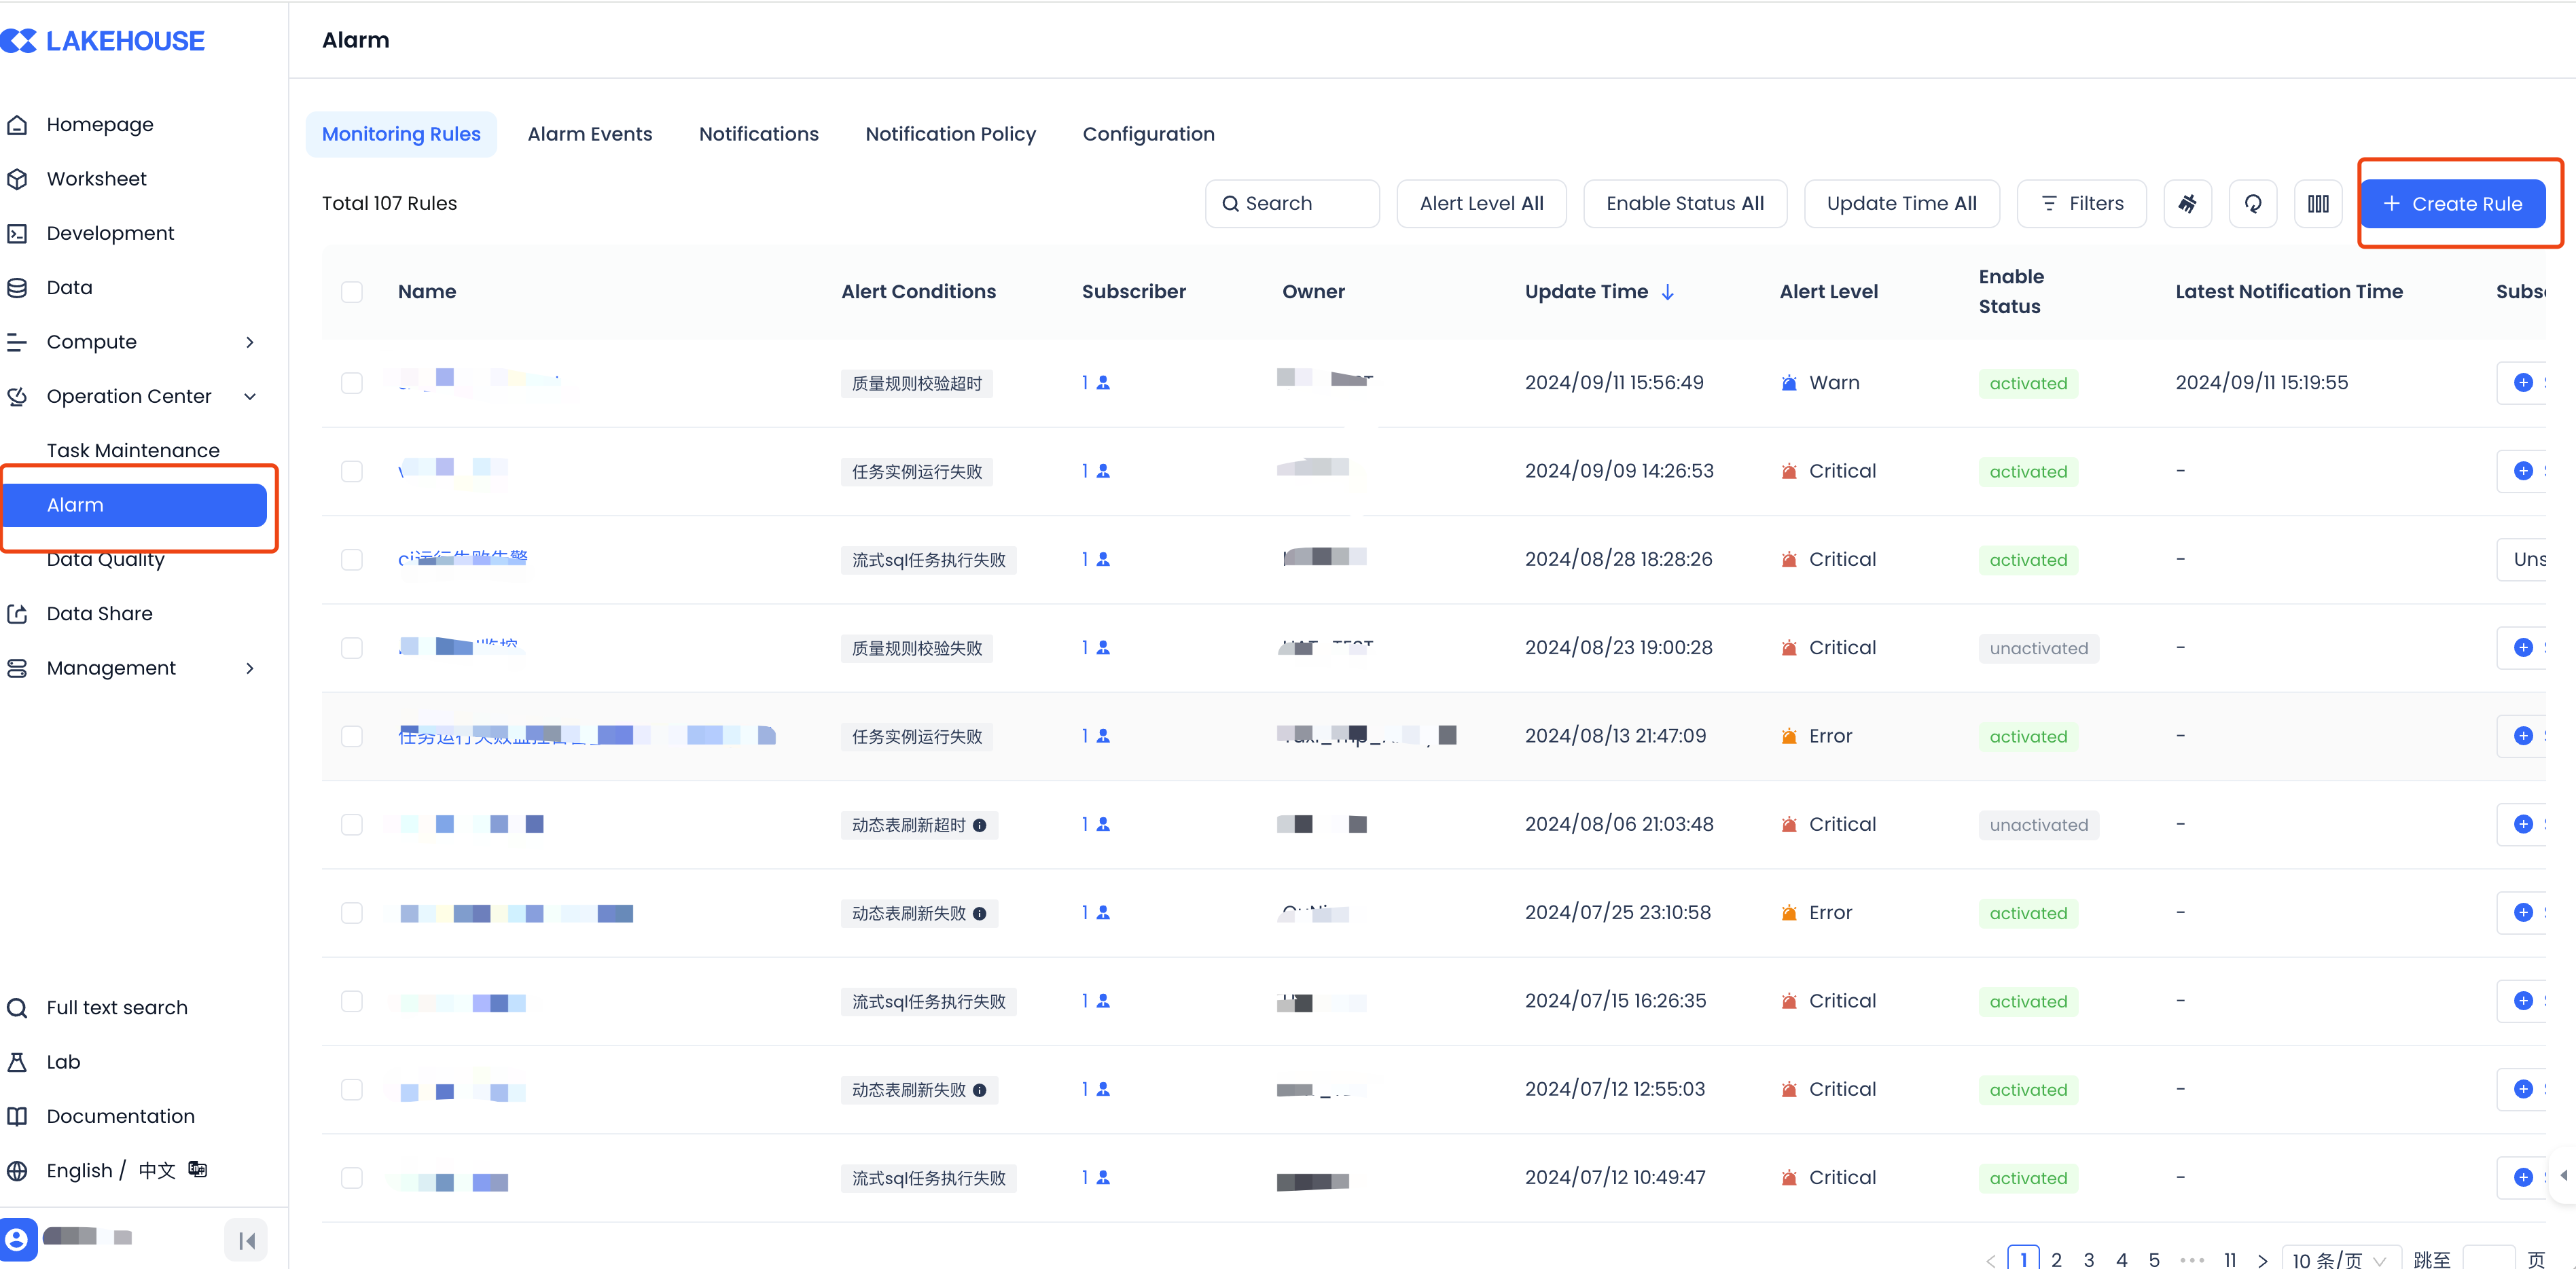
In the notification policy, you can configure the interval and number of pushes, such as sending once every 10 minutes, up to 6 times, to avoid missing alerts.
Use Data Quality Monitoring to Ensure Correct Data Output
In addition to monitoring the task scheduling operation status, to avoid logical issues caused by changes in upstream source data or subsequent code changes, it is also necessary to monitor the correctness and reasonableness of the data to ensure that the business side can use the data with confidence. Here, the Data Quality module's functionality will be used:
Quality Rule Configuration
In the Data Quality module, you can configure data quality monitoring rules to monitor the data in the tables produced by the tasks.
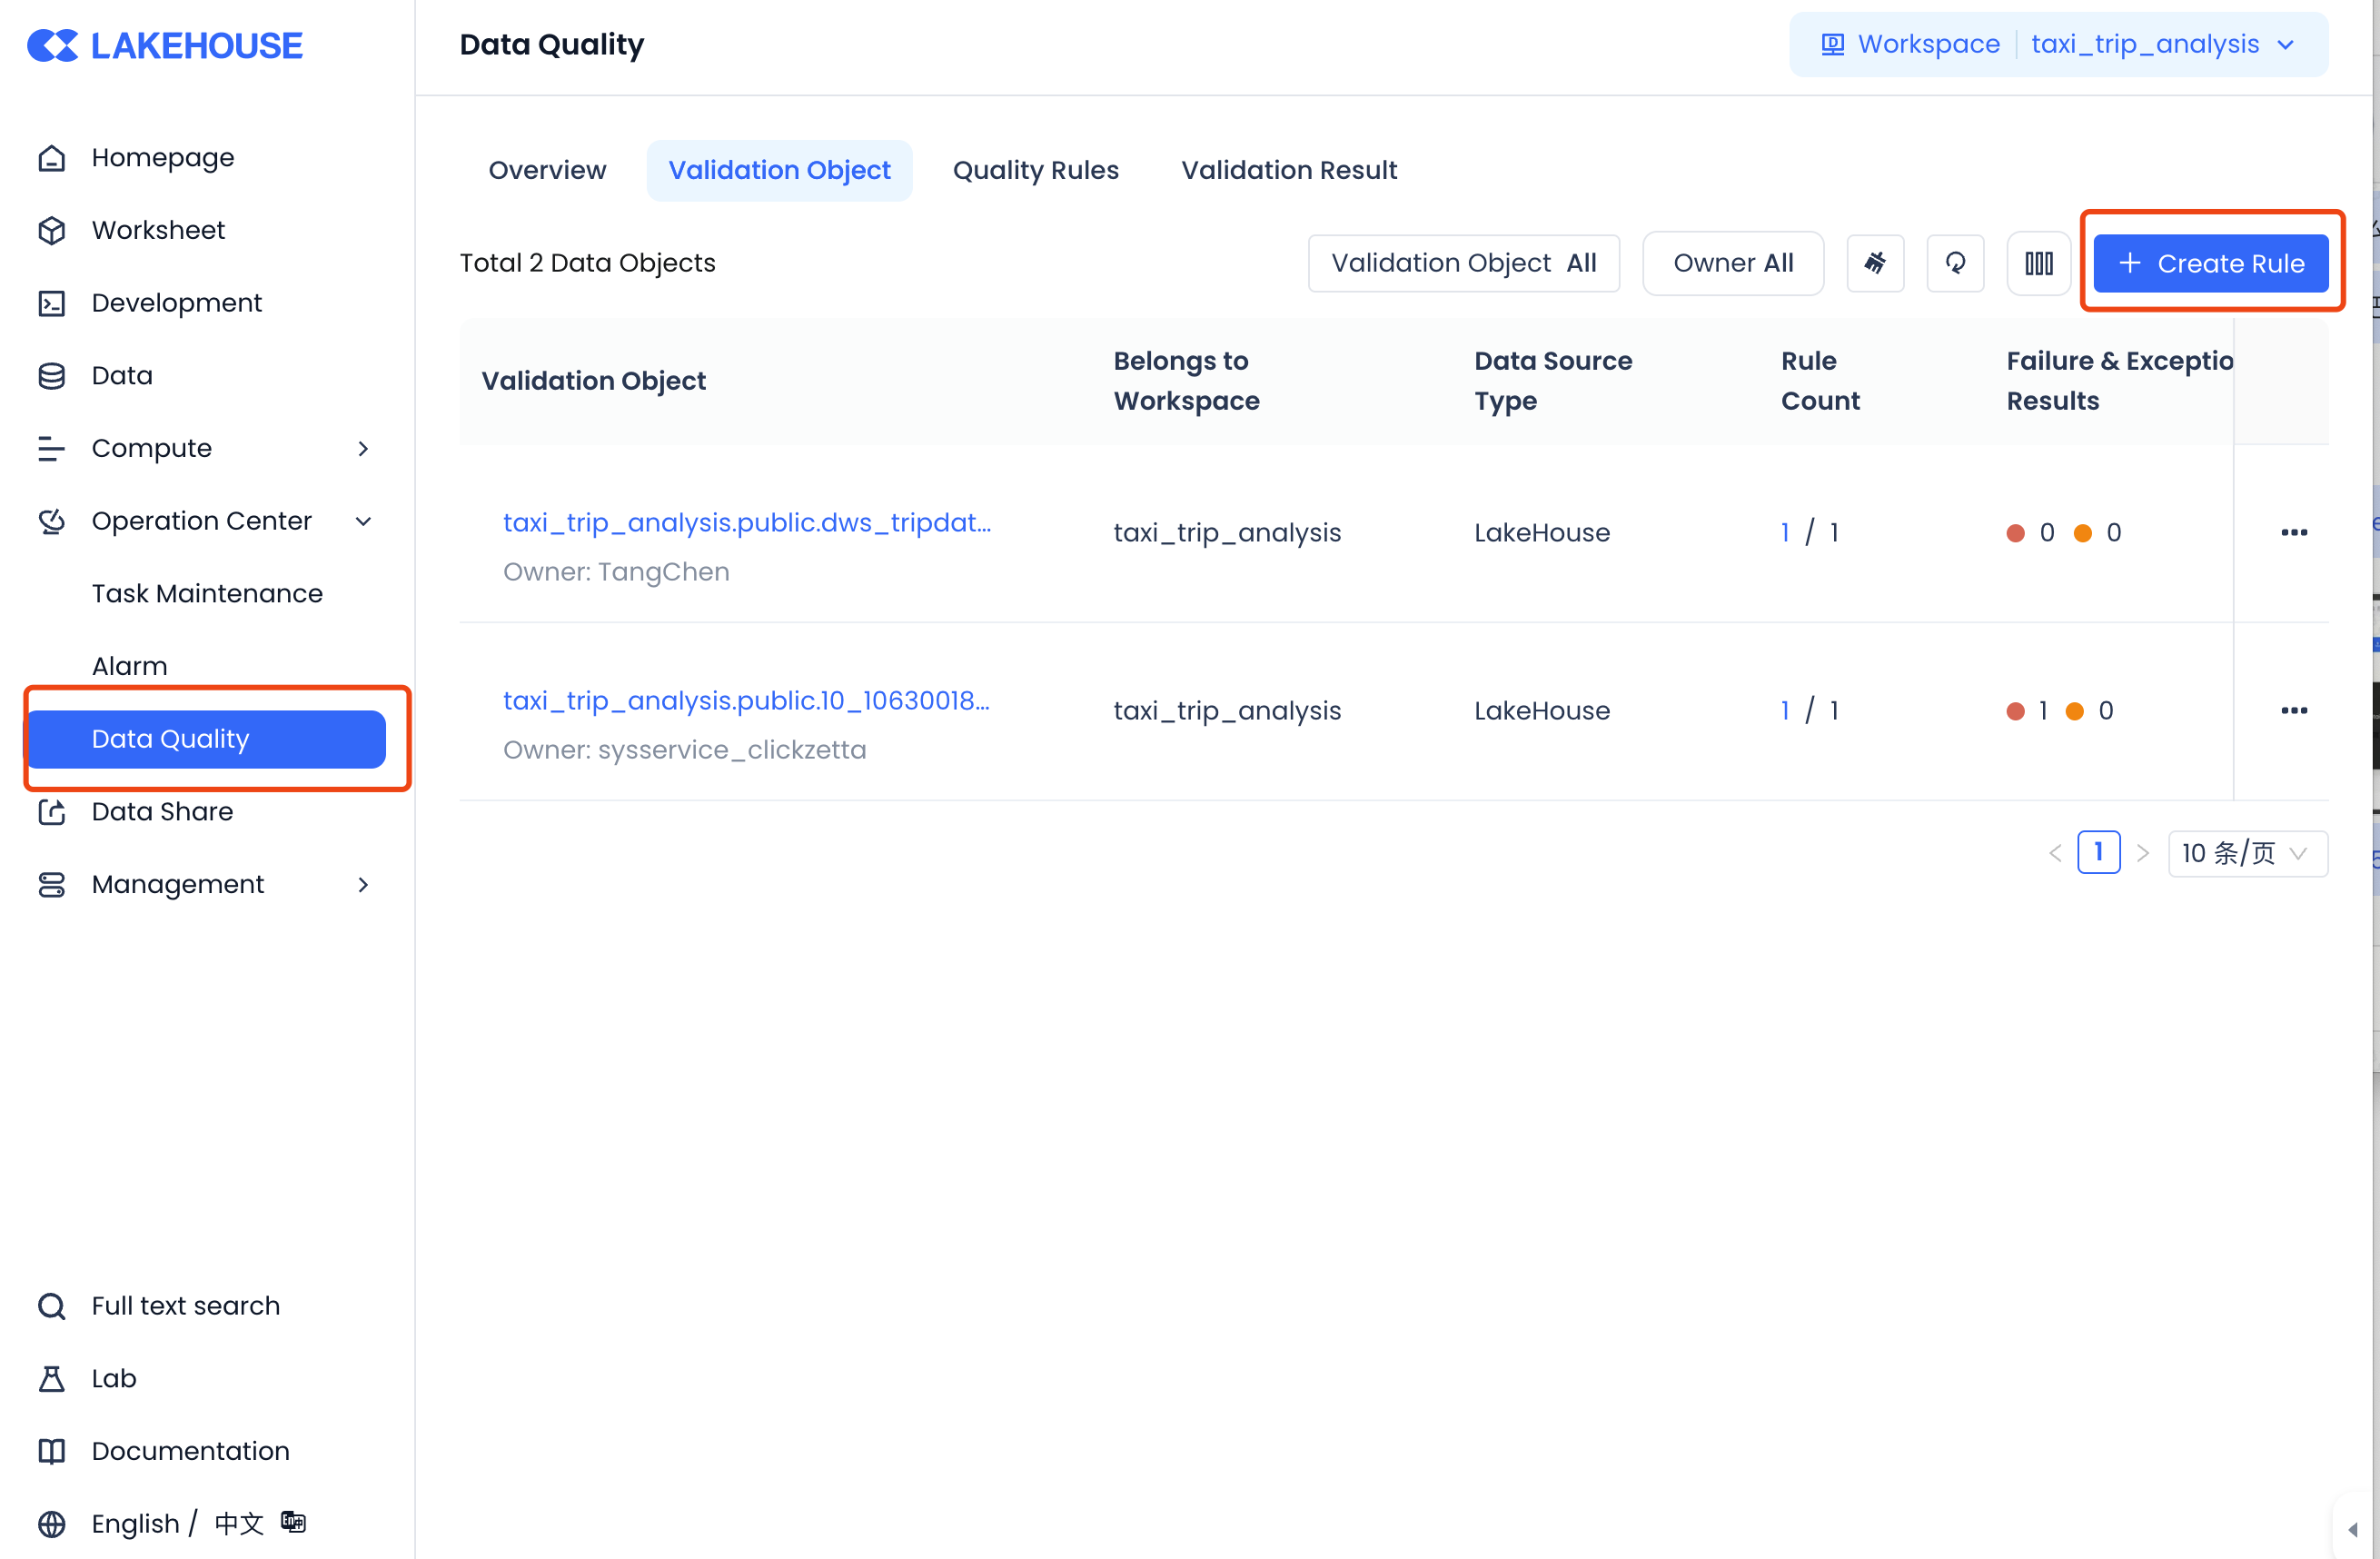
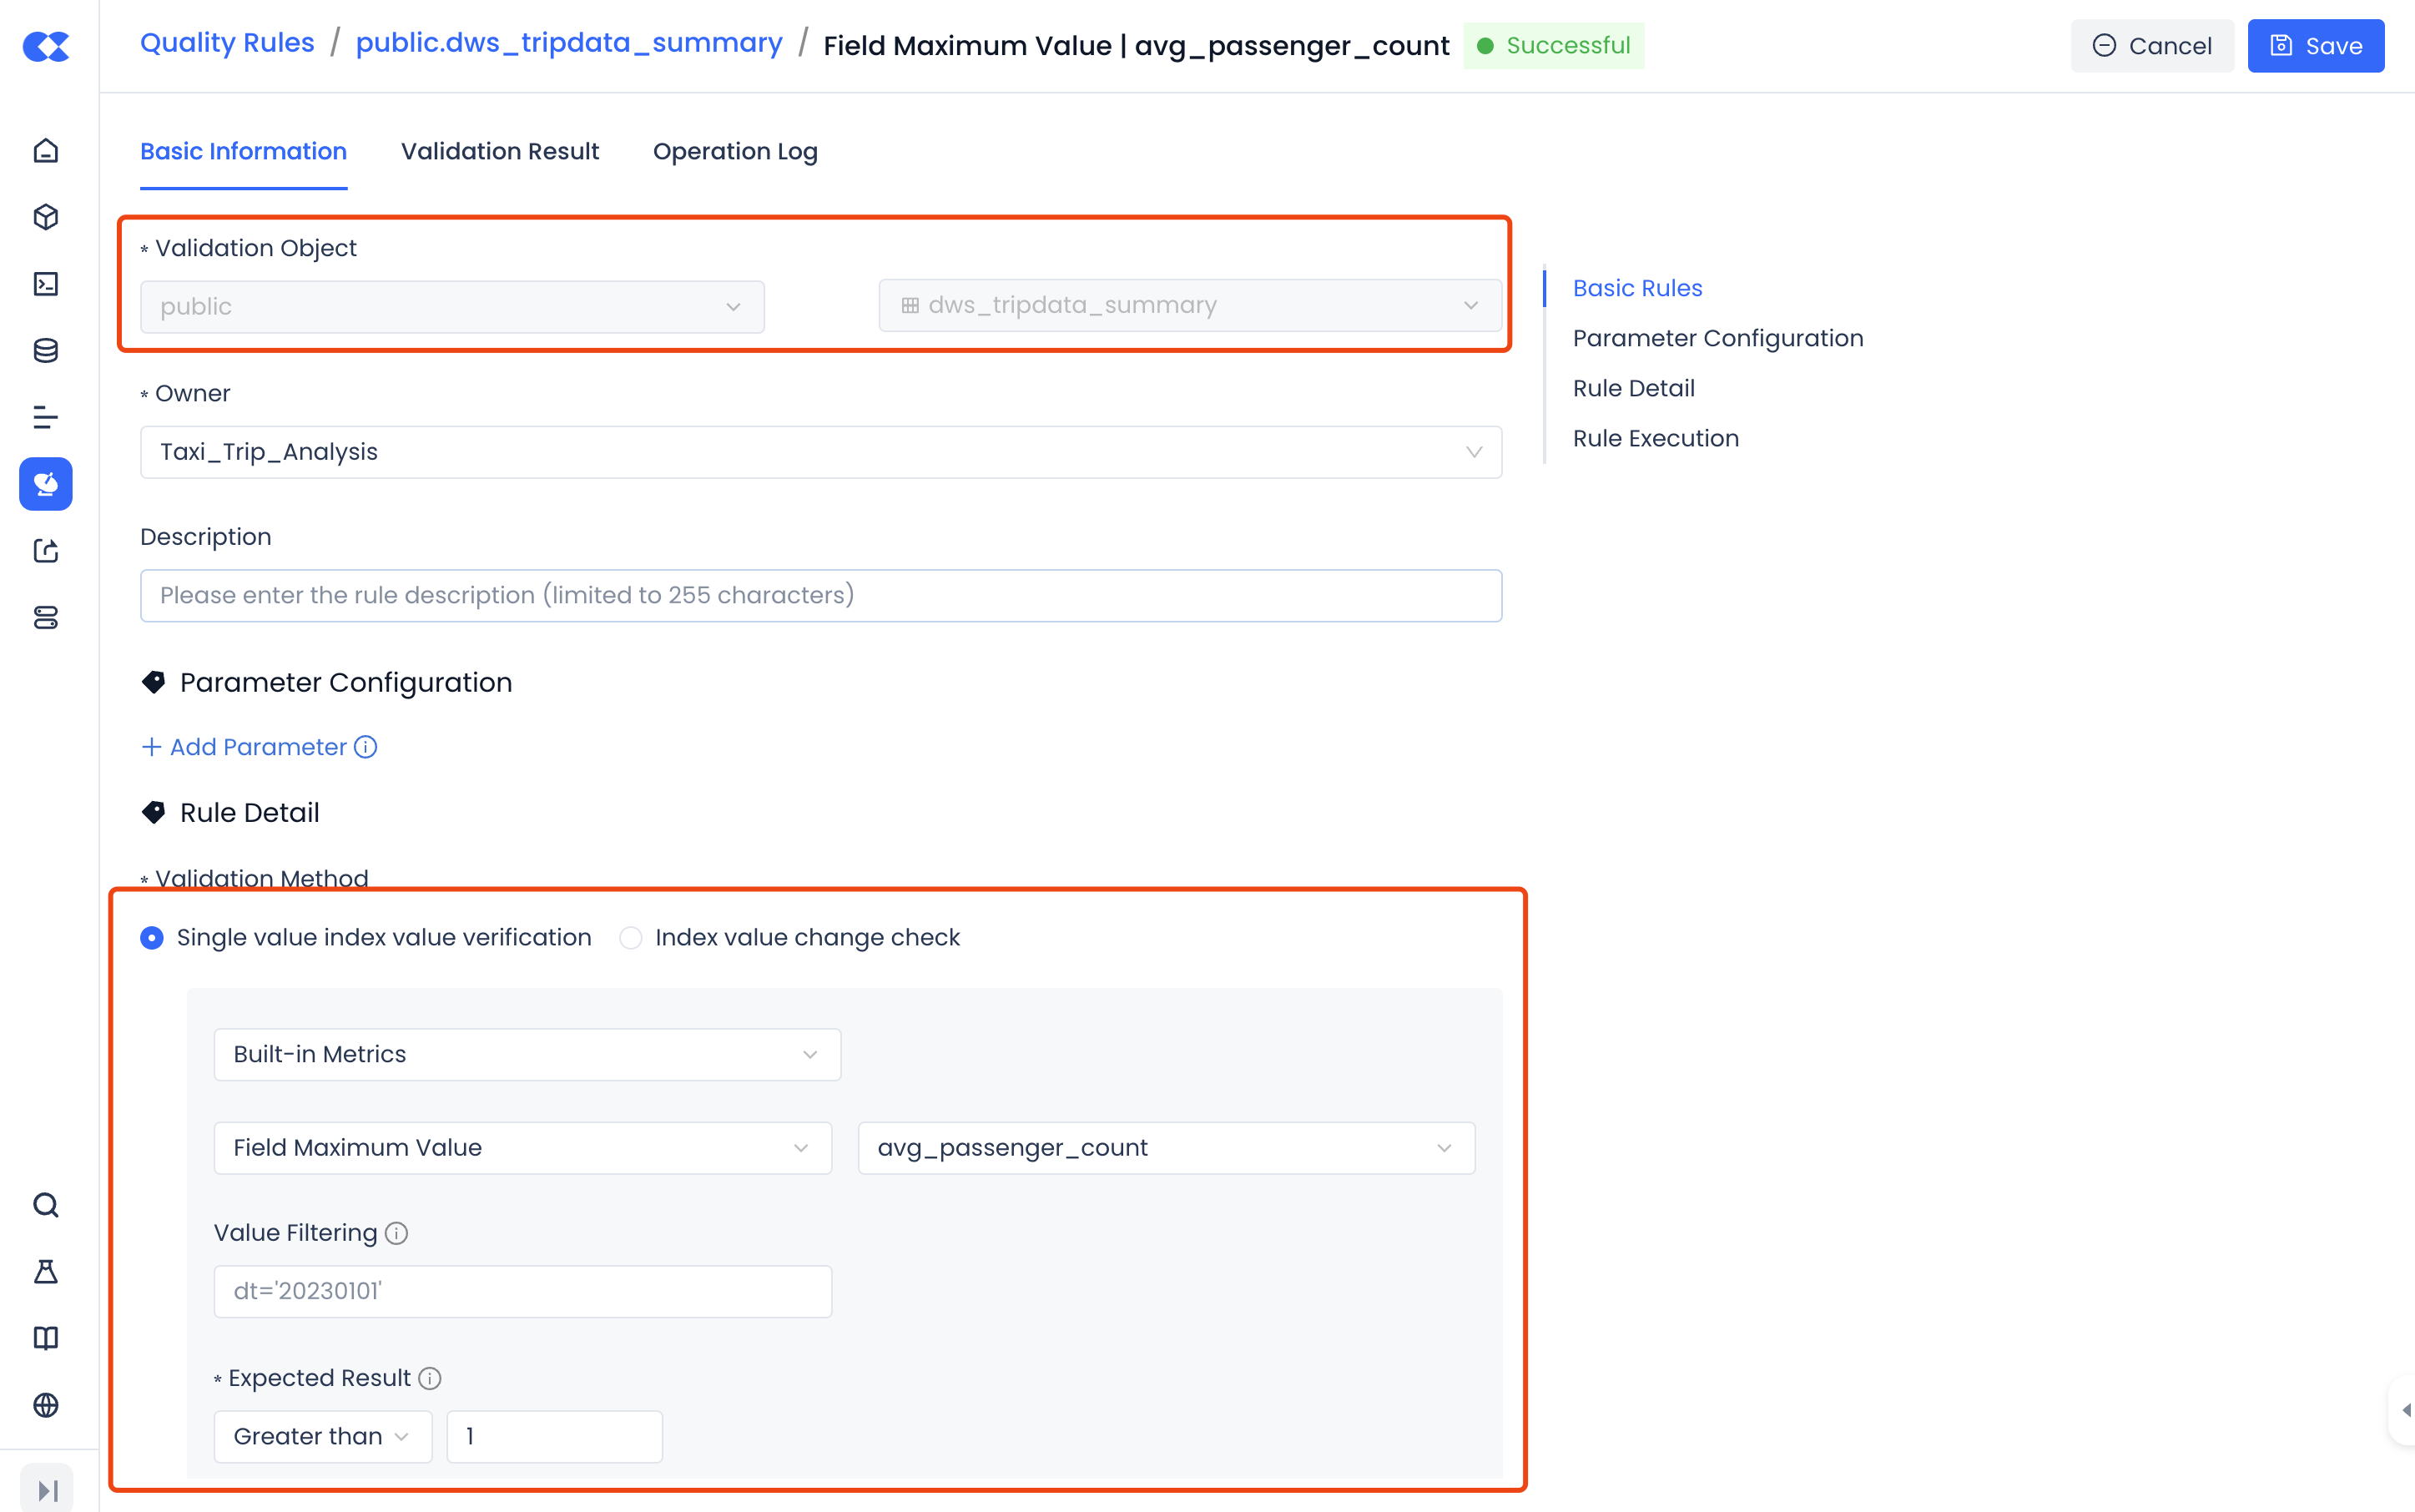
Taking the avg_passenger_count (average number of passengers) field in the dws_tripdata_summary table as an example, monitor that its maximum value is greater than 1 (i.e., there is at least 1 passenger on average), which can be configured as follows.
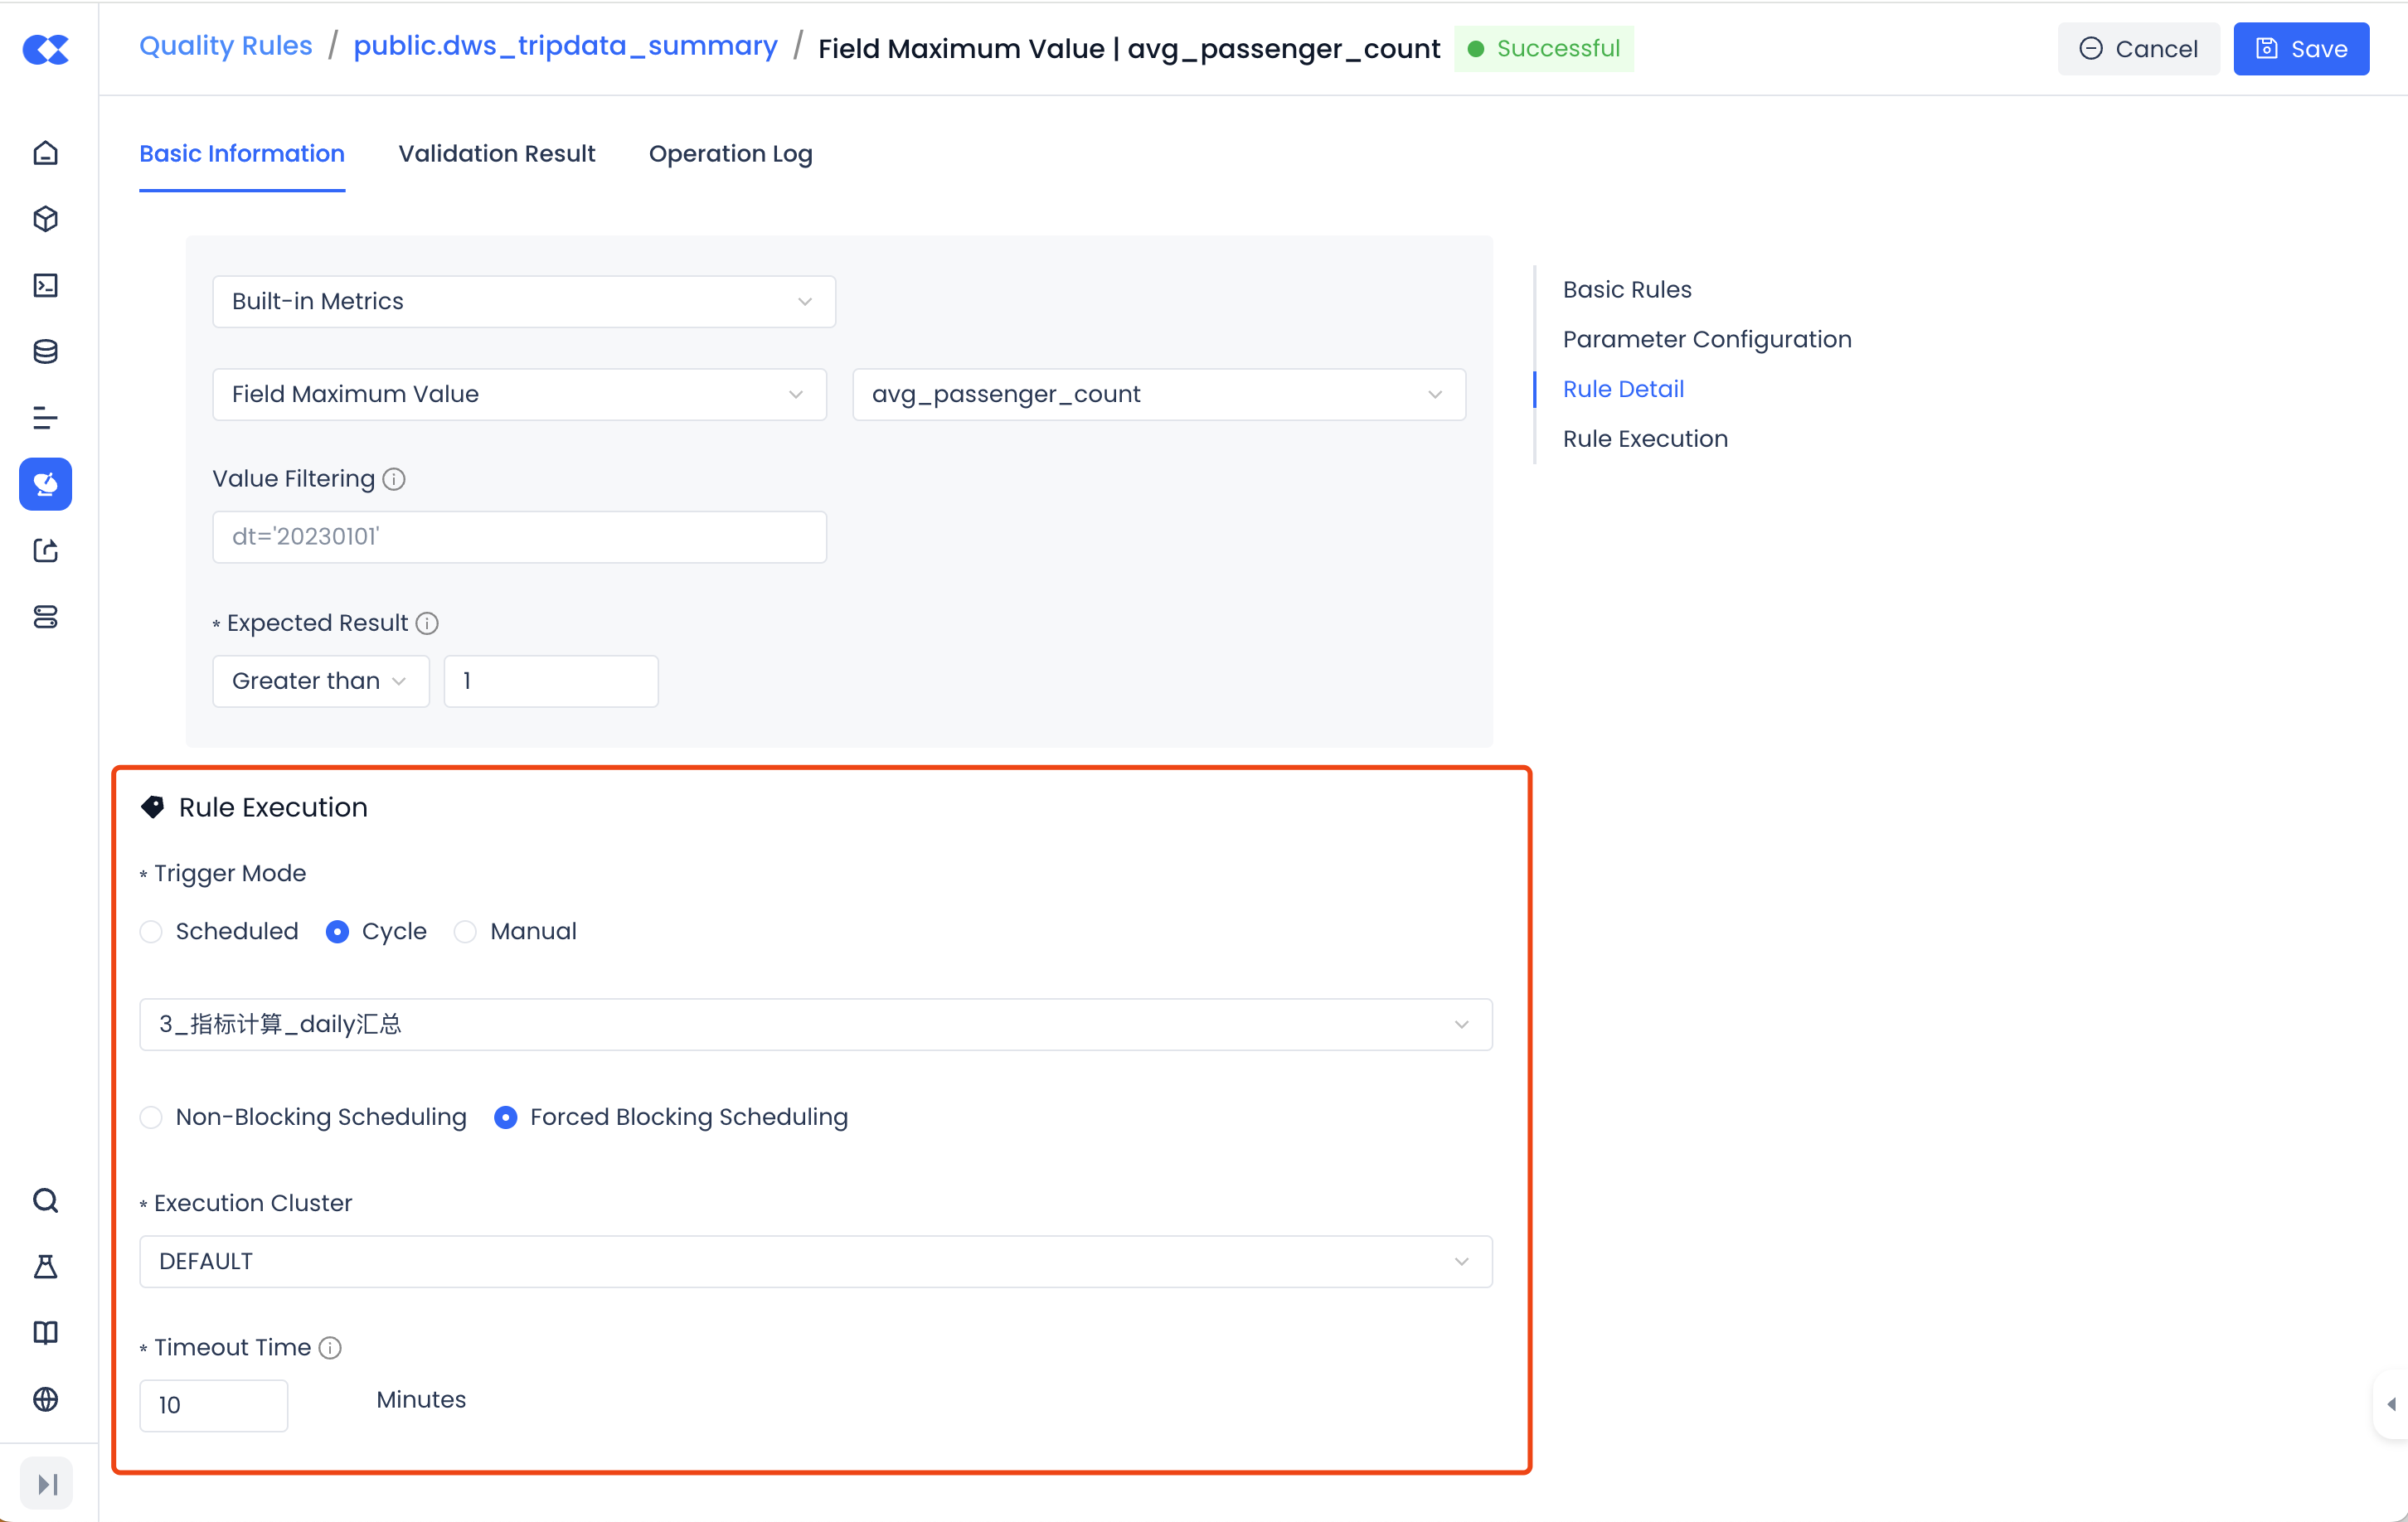
Quality Rule Execution
Quality rules support multiple triggering methods, such as manual triggering, scheduled triggering, and periodic task triggering. Manual triggering can be used to test the correctness of rule configurations. In this instance, the quality rule is configured as "periodic task triggering," which means it is triggered by the table's output task to achieve the purpose of triggering quality checks immediately after the task is completed. It is also configured to use the "strong blocking scheduling" mode, which means that if the quality rule check fails, the instance status of the associated scheduling task will also be set to fail, thereby blocking the scheduling operation of downstream task instances and preventing the spread of data issues.
Production Issue Operations
-
After the task scheduling runs, the task instance failure is detected through monitoring, and an IM alert is received.
-
Based on the content of the monitoring alert, you can directly reach the alert object.
-
Investigate the reason for the task instance failure and find code changes from the task's change records.
-
In operations, click the "Edit" button to view task details. In the task version, you can view the task's submission history.
-
Use the version comparison feature to see specific changes. Identify that the issue was introduced by a code logic change, perform a code rollback to fix it, and resubmit.
-
After resubmitting the task, go to the instance details page to perform instance operations and rerun the task instance. Be sure to select the latest code and configuration.
-
After the instance rerun is successful, the system will automatically trigger the rerun of the data quality rule, and the check will pass.
-
Check the task status monitoring. After the instance status is successfully restored through the rerun, the alert will automatically close and no longer push, requiring no manual operation.
Summary
By using the built-in features of Lakehouse Studio for data development, task scheduling, task operations, data quality, and monitoring alerts, you can be immediately alerted to handle task failures. Through operation auditing to locate changes, using version management for rollback, and rerunning task instances based on the rolled-back code, you can quickly handle issues. At the same time, the linkage between monitoring alert events and task instance status ensures that successful reruns will automatically close alerts without manual intervention, reducing the alert handling process. This can significantly save time in troubleshooting and data production recovery.
These features fully cover the needs of DataOps for data development management and data operations, providing solid support for "testable, monitorable, and rollbackable" data security and stable production.