A/B-Testing Shelf Layouts with Computer Vision Heatmaps

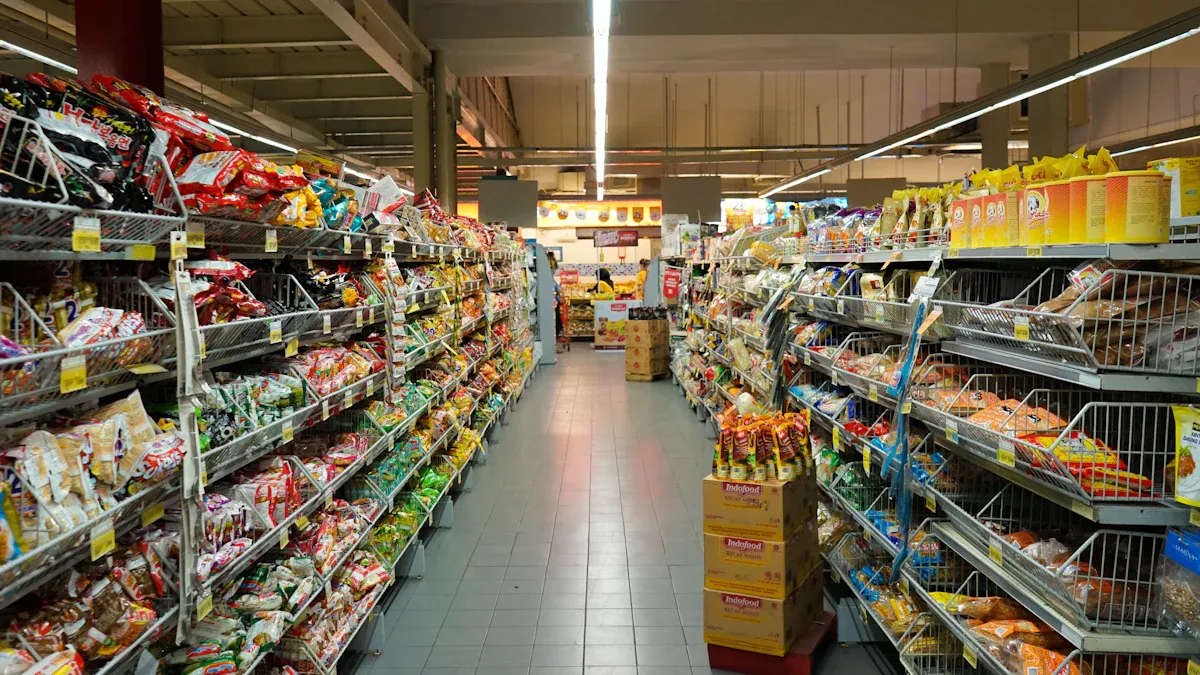
Imagine walking into a store where every product grabs your attention. This is the power of A/B-testing shelf layouts combined with computer vision heatmaps. By analyzing customer movements, heatmaps reveal which areas of a store attract the most attention. Retailers use this data to place products strategically, boosting visibility and sales.
Through this method, you can pinpoint sections that generate the highest revenue. AI tracks foot traffic patterns, helping you design layouts that match customer behavior. With these insights, you make smarter decisions about product placement, solving common retail challenges like low engagement and inefficient layouts.
When you optimize shelf layouts using heatmaps, you create a store environment that works for both customers and profits.
Key Takeaways
A/B testing lets stores compare shelf setups to see which works best.
Heatmaps from computer vision show where shoppers spend the most time.
Using A/B testing with heatmaps helps improve product placement and sales.
Testing layouts often with heatmap data keeps stores meeting shopper needs.
Understanding A/B-Testing Shelf Layouts
What is A/B Testing
A/B testing, also called split testing, is a method used to compare two versions of something to see which one performs better. In retail, this could mean testing two different shelf layouts to find out which one attracts more customers or generates higher sales. According to the Interaction Design Foundation, A/B testing is a quantitative research method. It involves showing different groups of people two variations and measuring their responses to determine the most effective option.
This approach provides actionable data that helps you make informed decisions. It reduces the risk of costly mistakes by relying on evidence rather than guesswork. Statistical tools, such as chi-square tests, ensure the results are reliable and meaningful.
What are Computer Vision Heatmaps
Computer vision heatmaps are visual tools that show where customers focus their attention in a store. Cameras and sensors capture data about customer movements. Advanced algorithms process this information to create heatmaps, which highlight high-traffic areas and overlooked spots. These heatmaps help you understand customer behavior, such as which shelves they visit most often or how long they spend in certain sections.
This technology is a game-changer for retail. It provides real-time insights that improve inventory management and optimize store layouts. By combining this data with A/B testing, you can design layouts that align with customer preferences.
Key Benefits for Retail Optimization
A/B-testing shelf layouts with computer vision heatmaps offers several advantages:
It maximizes retail space by identifying the best product placements.
It improves customer satisfaction by tailoring layouts to their behavior.
It boosts sales by highlighting products in high-traffic areas.
It minimizes risks by testing changes on a small scale before full implementation.
A/B testing also enhances decision-making by providing clear, data-driven insights. This combination of methods ensures your store layout works efficiently for both customers and profits.
The Synergy of A/B Testing and Heatmaps
Solving Retail Challenges with Data-Driven Insights
Retailers face numerous challenges, from underperforming product placements to inefficient use of store space. Data-driven insights offer a solution by providing clear, actionable information. When you combine A/B-Testing Shelf Layouts with computer vision heatmaps, you gain a powerful tool to address these issues. Heatmaps reveal customer behavior patterns, while A/B testing evaluates the effectiveness of layout changes. Together, they help you make decisions based on facts, not assumptions.
For example, an online retailer used click heatmaps to analyze their checkout process. They discovered that users often abandoned their carts because the 'Continue' button was hard to find. By redesigning the page to make the button more visible, they significantly increased conversions and reduced cart abandonment. This case study highlights how data visualization tools like heatmaps can uncover hidden problems and guide effective solutions.
Evidence Type | Description |
|---|---|
Data Visualization Tools | Facilitate interpretation of complex benchmarks through graphs, dashboards, and heat maps. |
Machine Learning Algorithms | Process vast datasets to uncover correlations and generate predictive insights for inventory optimization. |
Cloud-Based Analytics Platforms | Enable seamless access to benchmark data from multiple sources for a holistic view of performance. |
These tools empower you to interpret customer behavior and optimize your store layout. By leveraging data, you can solve retail challenges with precision and confidence.
Enhancing Shelf Layout Decisions with Heatmap Analysis
Heatmap analysis provides a visual representation of customer activity in your store. It shows where shoppers spend the most time and which areas they tend to ignore. This information is invaluable when designing shelf layouts. You can use it to highlight popular products or draw attention to underperforming sections.
In one study, a supermarket chain used heatmaps to analyze customer movement and dwell time. The results led to a 25% increase in foot traffic to previously overlooked areas. Another example showed how heatmaps informed product placement strategies, resulting in higher sales for featured items. These findings demonstrate the practical benefits of heatmap analysis in retail.
Study Description | Outcome |
|---|---|
A supermarket chain used heatmap technology to analyze customer movement and dwell time. | Resulted in a 25% increase in foot traffic to previously under-visited sections. |
Heatmaps in retail stores informed product placement strategies. | Led to increased sales of highlighted products. |
By incorporating heatmap analysis into your A/B-Testing Shelf Layouts, you can make data-backed decisions that enhance customer experience and boost sales.
Why This Combination is a Game-Changer for Retailers
The integration of A/B testing and heatmaps transforms how you approach retail optimization. Heatmaps provide visual data on customer interactions, revealing patterns that inform A/B testing strategies. This synergy allows you to test layout variations with precision, ensuring that every change is purposeful and effective.
The combination helps you identify overlooked elements in your store layout, enabling targeted improvements.
Heatmaps reveal customer behavior patterns, which guide A/B testing for better design decisions.
Using both tools together enhances user experience and increases conversion rates.
This approach empowers you to create a store environment that aligns with customer preferences. By continuously testing and refining your layouts, you can stay ahead in the competitive retail landscape.
Step-by-Step Guide to A/B-Testing Shelf Layouts
Define Objectives and Success Metrics
Before starting A/B-Testing Shelf Layouts, you need clear objectives and measurable success metrics. These guide your decisions and help you evaluate the effectiveness of your tests. Objectives should focus on improving customer engagement, increasing sales, or optimizing store space. Success metrics provide the benchmarks to measure progress.
Customer Engagement: Track how long shoppers spend in specific areas or how often they interact with products.
Sales Performance: Measure revenue generated by products in tested layouts.
Space Utilization: Assess how efficiently shelves and aisles are used.
Virtual shelf tests can simulate real-world shopping scenarios. These tests collect data on product interactions, helping you refine your metrics. Biosensors offer another layer of insight by capturing unbiased data on attention duration and the order in which items are viewed. These tools ensure your metrics align with actual customer behavior.
Tip: Start small by testing one or two objectives. This keeps your analysis focused and manageable.
Set Up Computer Vision Tools for Heatmap Generation
Computer vision tools are essential for generating heatmaps that visualize customer activity. To set them up, you need cameras or sensors strategically placed throughout your store. These devices capture data on movement patterns, dwell times, and areas of interest.
Once the hardware is installed, use software to process the data. Advanced algorithms convert raw information into heatmaps. These heatmaps highlight high-traffic zones and overlooked sections, giving you a clear picture of customer behavior.
Placement Strategy: Position cameras near entrances, aisles, and checkout counters to capture comprehensive data.
Software Selection: Choose tools that integrate seamlessly with your existing systems and offer real-time analytics.
Heatmaps provide actionable insights that inform your A/B tests. For example, if a heatmap shows low activity in a specific aisle, you can test new layouts to draw more attention to that area.
Note: Ensure your setup complies with privacy regulations. Inform customers about data collection to maintain trust.
Design and Implement A/B Test Variations
Designing A/B test variations involves creating two distinct shelf layouts to compare their performance. Each variation should focus on a specific aspect, such as product placement, signage, or aisle arrangement. Keep the changes simple to isolate their impact.
Variation A: Highlight popular products in high-traffic areas.
Variation B: Experiment with placing lesser-known items in prominent spots.
Implement the layouts in separate sections of your store or during different time periods. Use heatmaps to track customer interactions with each variation. This data helps you identify which layout performs better based on your success metrics.
Tip: Test one variable at a time. For example, if you’re testing product placement, keep signage and aisle arrangements consistent across both variations.
Analyze Heatmap Data for Actionable Insights
Heatmap data provides a wealth of information about customer behavior. To turn this data into actionable insights, you need to focus on patterns and trends. Look for areas where customers spend the most time or sections they tend to avoid. These insights help you identify what works and what needs improvement in your store layout.
For example, a fintech startup used heatmap tracking to improve their pricing page. They noticed users were not scrolling past the initial view. By redesigning the page to make pricing options more visible, they reduced bounce rates and increased customer retention. This example shows how analyzing heatmap data can lead to meaningful changes that improve performance.
To calculate the return on investment (ROI) of heatmap strategies, you should consider the costs of tools and data analysis. Compare these costs to the financial gains from the insights. Use the formula: (Gains from Investment – Cost of Investment) / Cost of Investment. This calculation gives you a clear percentage that shows the value of your heatmap efforts.
Large companies also use heatmap data to improve product placement and store design. By studying customer interactions, they refine layouts to boost engagement and satisfaction. These strategies demonstrate how heatmaps can guide decisions that enhance both customer experience and sales.
Tip: Focus on one or two key insights at a time. This approach makes it easier to implement changes and measure their impact.
Iterate and Optimize Based on Results
Once you analyze the heatmap data, use the insights to refine your shelf layouts. Start by testing small changes based on the patterns you observed. For instance, if a heatmap shows low activity in a specific aisle, try rearranging the products or adding signage to draw attention.
After implementing changes, monitor the results using the same tools. Compare the new heatmaps to the original ones to see if the adjustments improved customer engagement or sales. This iterative process ensures that your layouts continue to evolve based on real data.
A/B-Testing Shelf Layouts plays a crucial role in this optimization cycle. By testing different variations, you can identify the most effective layout for your store. Combine this with heatmap analysis to make data-driven decisions that maximize your retail space.
Note: Optimization is an ongoing process. Regularly review your heatmap data to stay ahead of changing customer preferences.
Real-World Applications of A/B-Testing Shelf Layouts
Examples of Successful Retail Implementations
Retailers worldwide have embraced A/B testing with heatmaps to improve store layouts. For instance, a grocery chain tested two shelf arrangements for their snack aisle. One layout grouped similar items together, while the other mixed complementary products. Heatmaps revealed that the second layout encouraged more cross-category purchases. This approach increased sales by 18% in just one month.
Another example comes from a clothing retailer. They used heatmaps to test the placement of promotional displays. By moving these displays to high-traffic zones identified by heatmaps, they boosted sales of featured items by 25%. These examples show how small changes, guided by data, can lead to significant results.
Case Studies Demonstrating Measurable Improvements
A/B testing combined with heatmaps has delivered measurable improvements across various industries. One case study involved a bookstore testing two layouts for their bestsellers section. The first layout placed books alphabetically, while the second grouped them by genre. Heatmap analysis showed that customers spent more time browsing the genre-based layout. This change led to a 20% increase in sales for that section.
Another case study focused on a home goods store. They tested the placement of seasonal items in different parts of the store. Heatmaps revealed that placing these items near the entrance attracted more attention. This strategy resulted in a 30% increase in seasonal product sales.
Lessons Learned from Practical Experiments
Practical experiments in retail have highlighted valuable lessons. For example, personalized layouts tailored to customer preferences often outperform generic designs. A test involving personalized content for returning customers increased conversion rates by 30%. Similarly, adding star ratings to product displays boosted sales by 15% and revenue per session by 17%. These findings emphasize the importance of understanding customer behavior.
Hypothesis | Result | Lesson Learned |
|---|---|---|
Personalized content for returning customers will boost engagement and conversion rate. | A unique variant increased conversion rate by 30%. | Ecommerce brands can leverage personalized content experiences to boost site engagement for returning users. |
Adding star ratings can boost add to cart and average order value. | Increased conversion rate by 15% and revenue per session by 17%. | Customers want to see reviews; not having them can hinder sales. |
Single-page checkout will outperform multi-step checkout. | Single-page checkout increased transactions by 21.8%. | Checkout processes should be tested as preferences vary by audience. |
You can apply these lessons to your store by testing layouts that prioritize customer needs. Free shipping incentives, visible reviews, and streamlined checkout processes are just a few strategies that have proven effective.
Tip: Always test one variable at a time to isolate its impact and gain clearer insights.
Best Practices for A/B-Testing Shelf Layouts
Conduct Tests in Real-World Conditions
Testing in real-world conditions ensures that your results reflect actual customer behavior. To achieve this, follow a structured approach:
Identify critical scenarios and design test cases that align with your objectives.
Set up the necessary infrastructure, such as cameras or sensors, to capture accurate data.
Execute tests while monitoring for potential issues.
Troubleshoot and resolve any problems that arise during the testing phase.
Document and report on the results to track progress.
Refine your testing strategies based on the findings.
This process helps you simulate real shopping experiences, ensuring that your insights are practical and actionable.
Tip: Conduct tests during peak and off-peak hours to capture a comprehensive view of customer behavior.
Ensure Data Accuracy and Reliability
Accurate data is the foundation of effective A/B testing. Use reliable metrics and validation techniques to maintain data integrity. The following table highlights key methods:
Technique/Metric | Description |
|---|---|
Standardization | Use consistent units, terms, and formats to ensure data comparability. |
Error Margins and Uncertainty Levels | Record error margins and apply strategies to detect and correct errors during data collection. |
Anomaly Detection Algorithms | Leverage automated tools to identify and manage data inconsistencies. |
By implementing these techniques, you can trust the insights derived from your tests and make informed decisions.
Note: Regularly audit your data collection processes to identify and address potential inaccuracies.
Interpret Results for Effective Decision-Making
Interpreting A/B testing results requires a clear understanding of key metrics and statistical frameworks. The table below outlines essential metrics:
Metric | Description |
|---|---|
Uplift | Measures the performance difference between a variation and the control group. |
Probability to Be Best | Indicates the likelihood of a variation outperforming others in the long term. |
A/B testing is an iterative process. Start by setting clear objectives and hypotheses. Analyze results to identify trends and refine your strategies. For example, a travel website improved its hotel recommendations by continuously testing and adjusting its algorithm based on booking rates and customer feedback. This approach led to more accurate suggestions over time.
Tip: Focus on statistical significance and sample size to ensure your results are meaningful and actionable.
Combining A/B testing with computer vision heatmaps transforms how you optimize shelf layouts. This approach helps you understand customer behavior, test layout variations, and make data-driven decisions that boost sales and satisfaction.
📊 Tip: Use heatmaps to identify high-traffic areas and test layouts that maximize product visibility.
Adopting this strategy ensures your store evolves with customer preferences. Continuous testing and refinement keep your layouts effective and relevant. By leveraging these tools, you create a shopping experience that benefits both your customers and your bottom line.
FAQ
What is the ideal duration for an A/B test in retail?
The ideal duration depends on your store's foot traffic. For high-traffic stores, a week may suffice. For lower traffic, you might need two to four weeks. Ensure you gather enough data to make reliable conclusions.
Do heatmaps work for all types of retail stores?
Yes, heatmaps work for most retail environments, including grocery stores, clothing outlets, and electronics shops. They provide insights into customer behavior regardless of store type. However, the setup may vary based on store size and layout.
How do you ensure customer privacy when using heatmaps?
You can ensure privacy by anonymizing data and avoiding facial recognition. Inform customers about data collection through clear signage. Use tools that comply with privacy regulations like GDPR or CCPA.
Can small businesses afford A/B testing with heatmaps?
Yes, small businesses can use affordable tools and start with basic setups. Many platforms offer scalable solutions tailored to smaller budgets. Begin with a single test area to minimize costs while gaining valuable insights.
What metrics should you prioritize when analyzing heatmaps?
Focus on dwell time, foot traffic, and interaction rates. These metrics reveal where customers spend time and which products attract attention. Use this data to optimize layouts and improve sales performance.
See Also
Creating A Data-Focused Framework For Retail Product Introductions
SQL And BI Techniques To Analyze User Behavior Easily
Creating A Funnel Analysis To Understand Purchase Drop-Offs
Identifying Workflow Bottlenecks Using Path And Goal Analysis
