Lakehouse Job History
Through the job history page, you can view detailed information about queries executed in the Lakehouse account over the past 7 days. This page displays a list of historical jobs, including tasks submitted using your own jdbc jar, studio temporary queries, and studio periodic scheduling tasks.
Job History
View History
Click on Compute in the left navigation bar, then click on Job History to enter the job history page:
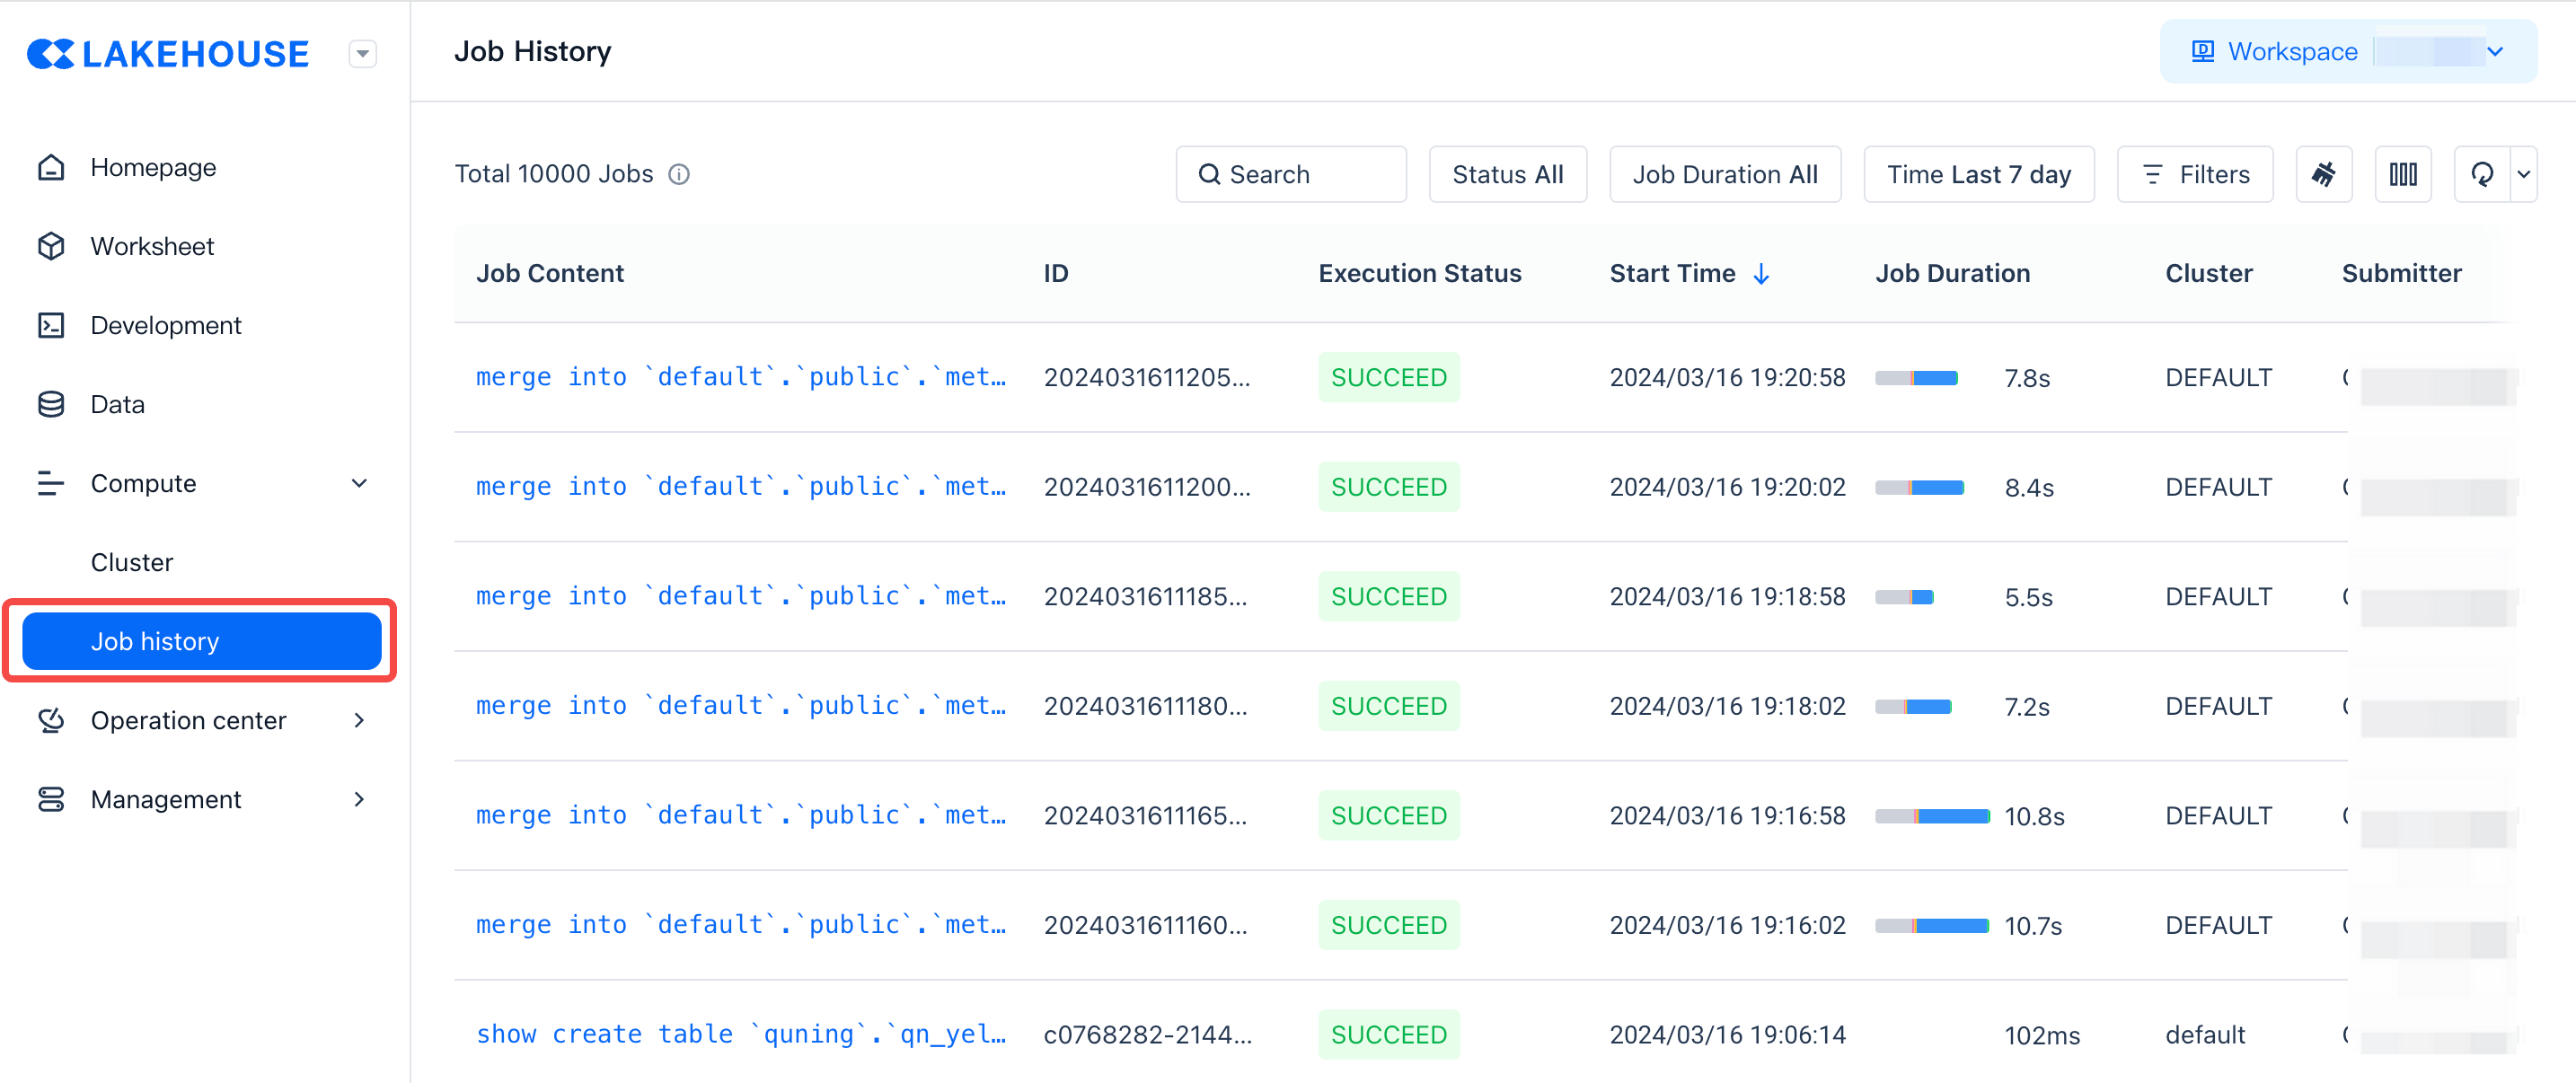
Job History Search
- Supports searching by job ID generated by SQL jobs
- Supports searching by status
- setup: SQL initialization phase, including operations such as compilation and optimization
- resuming_cluster: Waiting for vc to start, if it takes a long time, please contact technical support
- queued: Job is queued waiting for resources, if it takes a long time, check if vc resources are fully occupied, consider expanding vc
- running: SQL data processing time, you can click on diagnostics to view the time taken by each operator
- finish: Job has ended, some jobs may have a cleanup process in this stage, which can take time
- Supports filtering by duration
- Supports filtering by time, currently up to 10,000 jobs from the past seven days can be queried
- Supports filtering by the name of the cluster where the job ran
- Supports filtering by the job submitter
- Supports filtering by queryTag
Users can use the command set query_tag="" to indicate the source of the job and tag the job when submitting SQL. This makes it easy to filter in this interface
- Set query_tag in the studio interface, select two days of SQL to execute simultaneously
- Add
query_tagin the JDBC URL, so each submitted SQL will carry thequery_tagto indicate the source, which can be filtered on the page. - Set query_tag in python code
- The default Schema for the job, the context in which the submitted SQL runs, can be obtained through select current_schema().
Job Details
Enter the job details to view detailed information about the job.
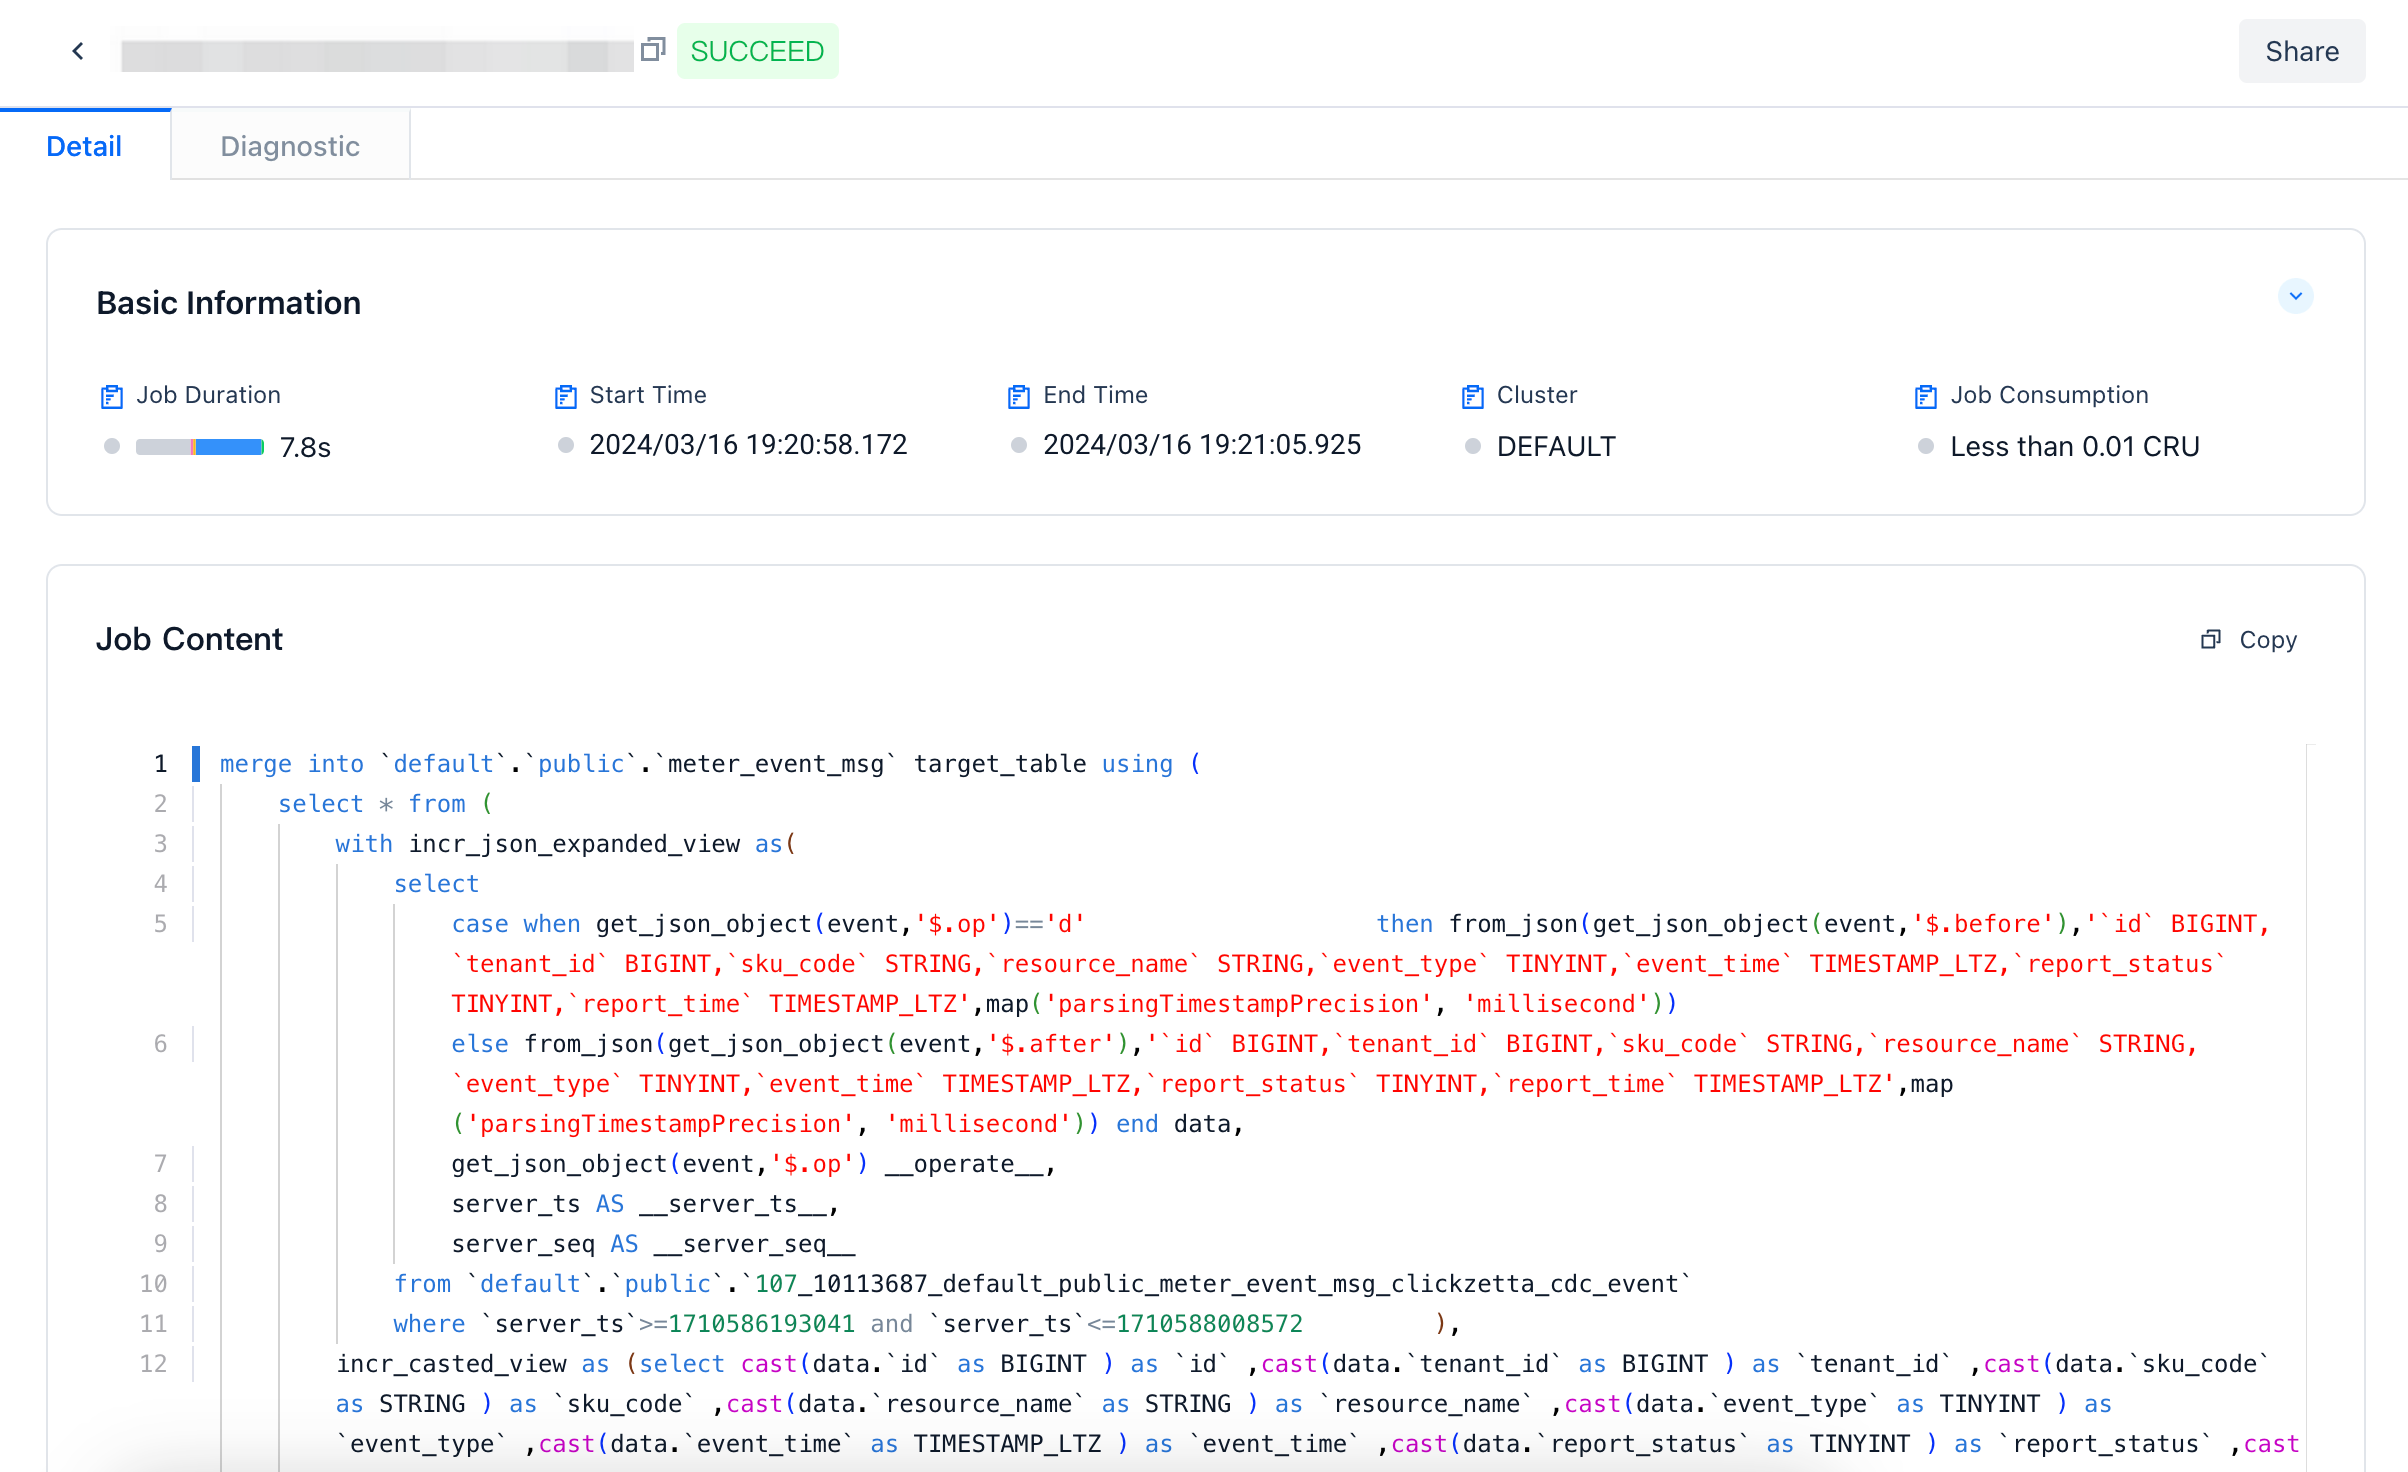
Field Information Explained as Follows
| Field | Description |
| Status | Indicates the status of the job, currently includes Ready to execute: The job is being compiled and other operations Waiting to execute: Waiting for resources Executing: Running, the job is processing data Execution successful: The job ran successfully Execution terminated: The job was terminated Execution failed: The job failed to run |
| Submit Time | The time the server received the request to start |
| End Time | The time the job ended |
| Duration | Includes compilation optimization, starting computing resources, queuing, and job running time |
| Owner | The user who submitted the job |
| Spill to Disk | The size of the data spilled to disk, this parameter can help understand if the performance is slow due to insufficient cluster memory resources |
| Read from Cache | In the analytical cluster, the already read data will be cached first to speed up computation |
| Output Records | The number of output records of the job |
| Consumption | Refers to the computing resources used by the job, excluding the computing resources while the job is waiting for IO. |
| Cluster | The cluster used to run the job |
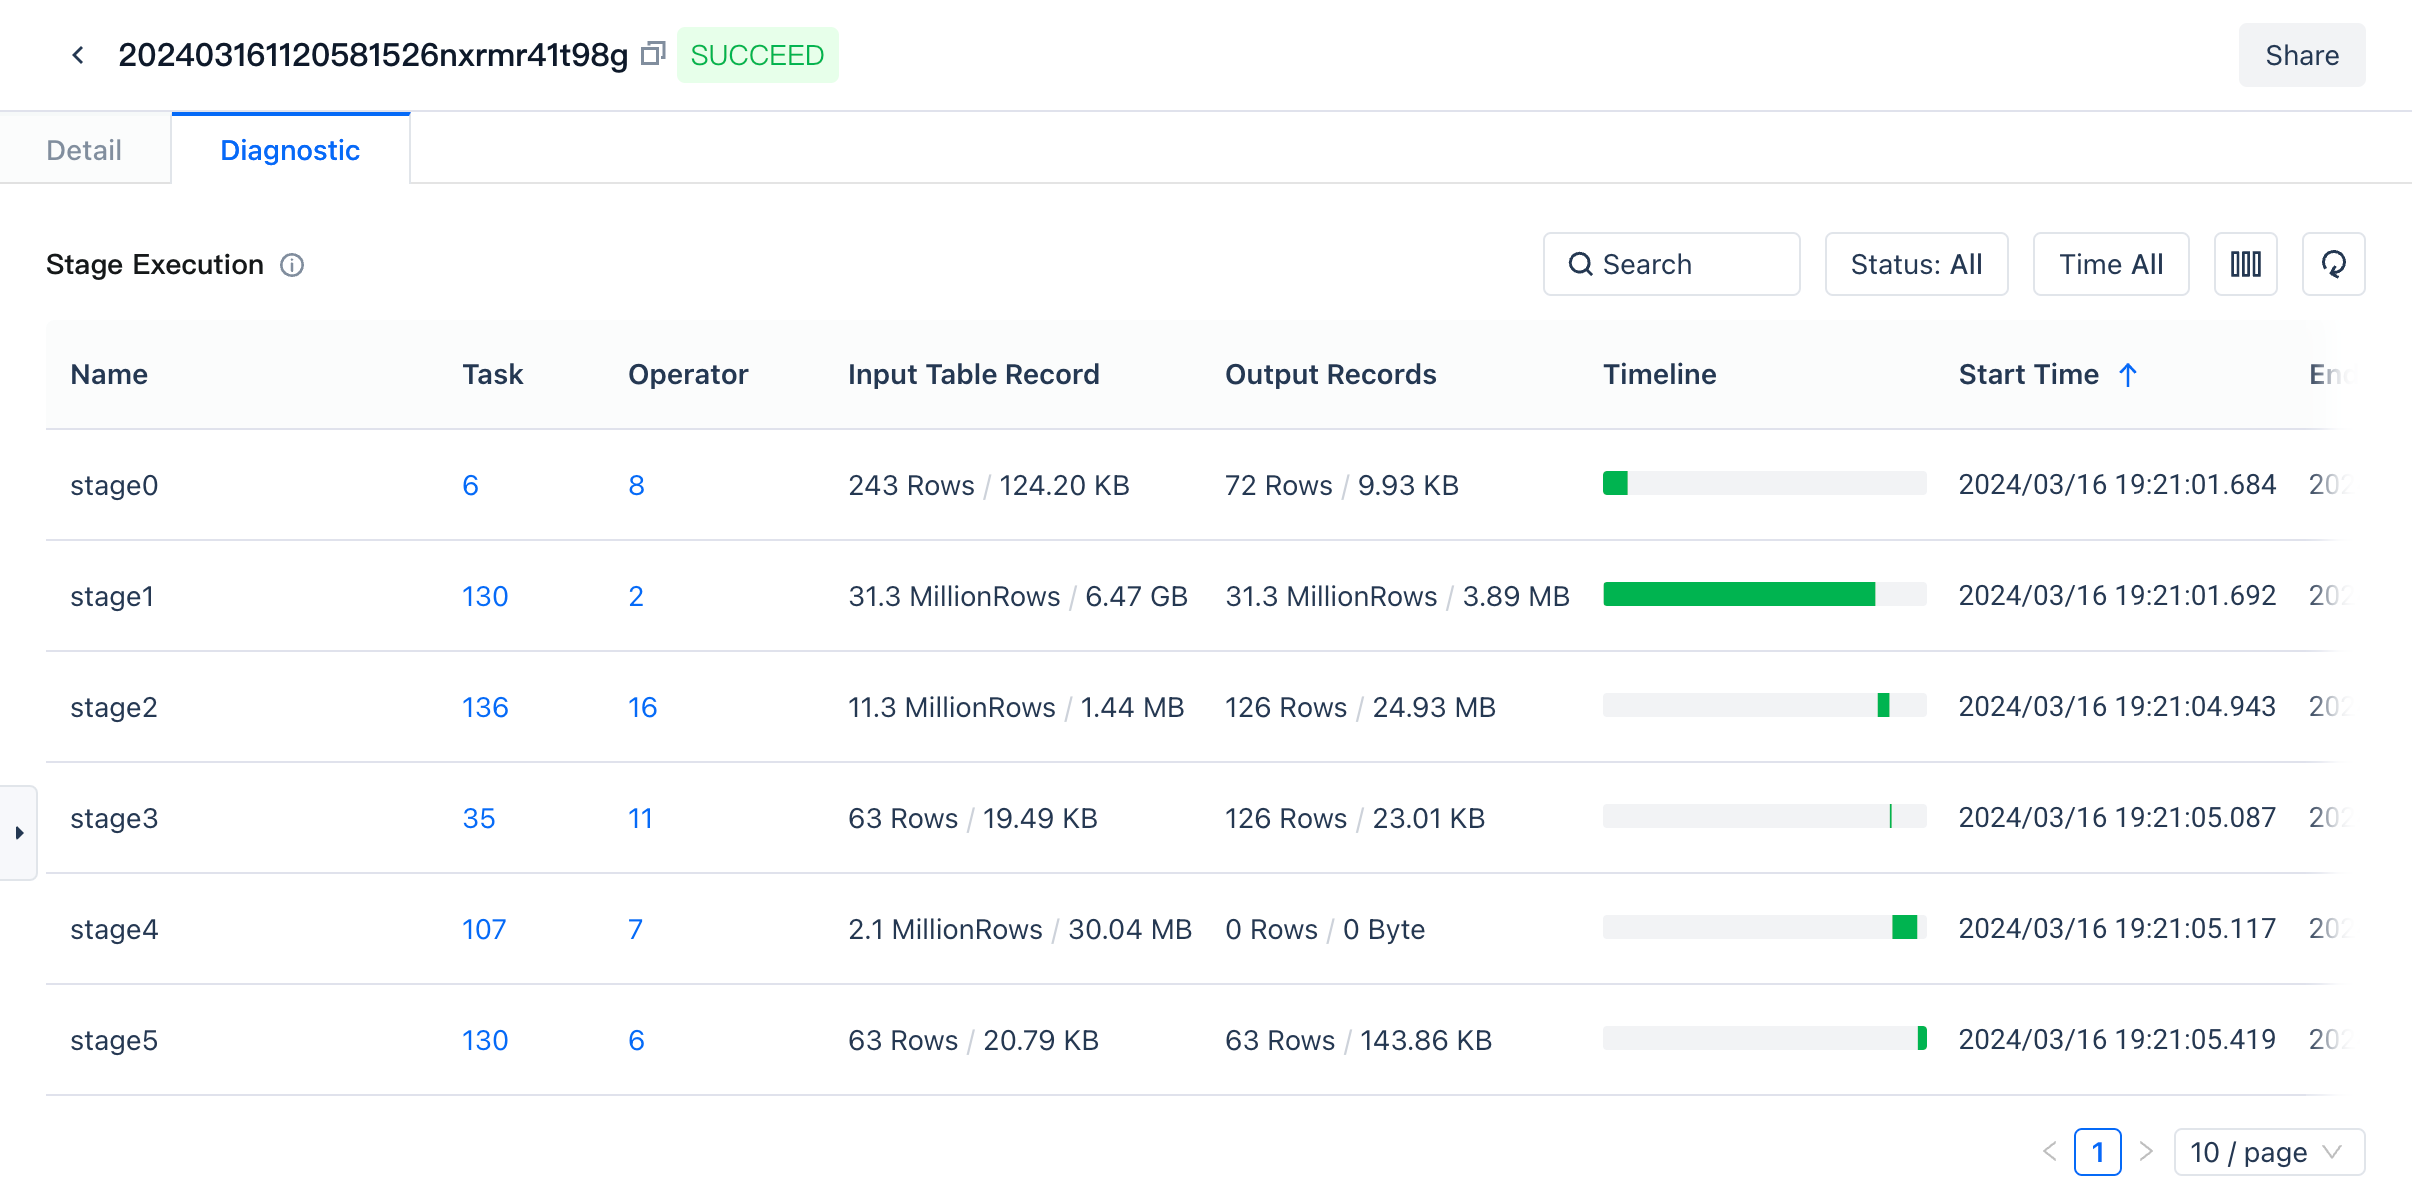
Stage Interface
SQL execution is divided into each stage, and stages are executed from bottom to top. Clicking on a specific stage will show the specific time consumption of each stage.
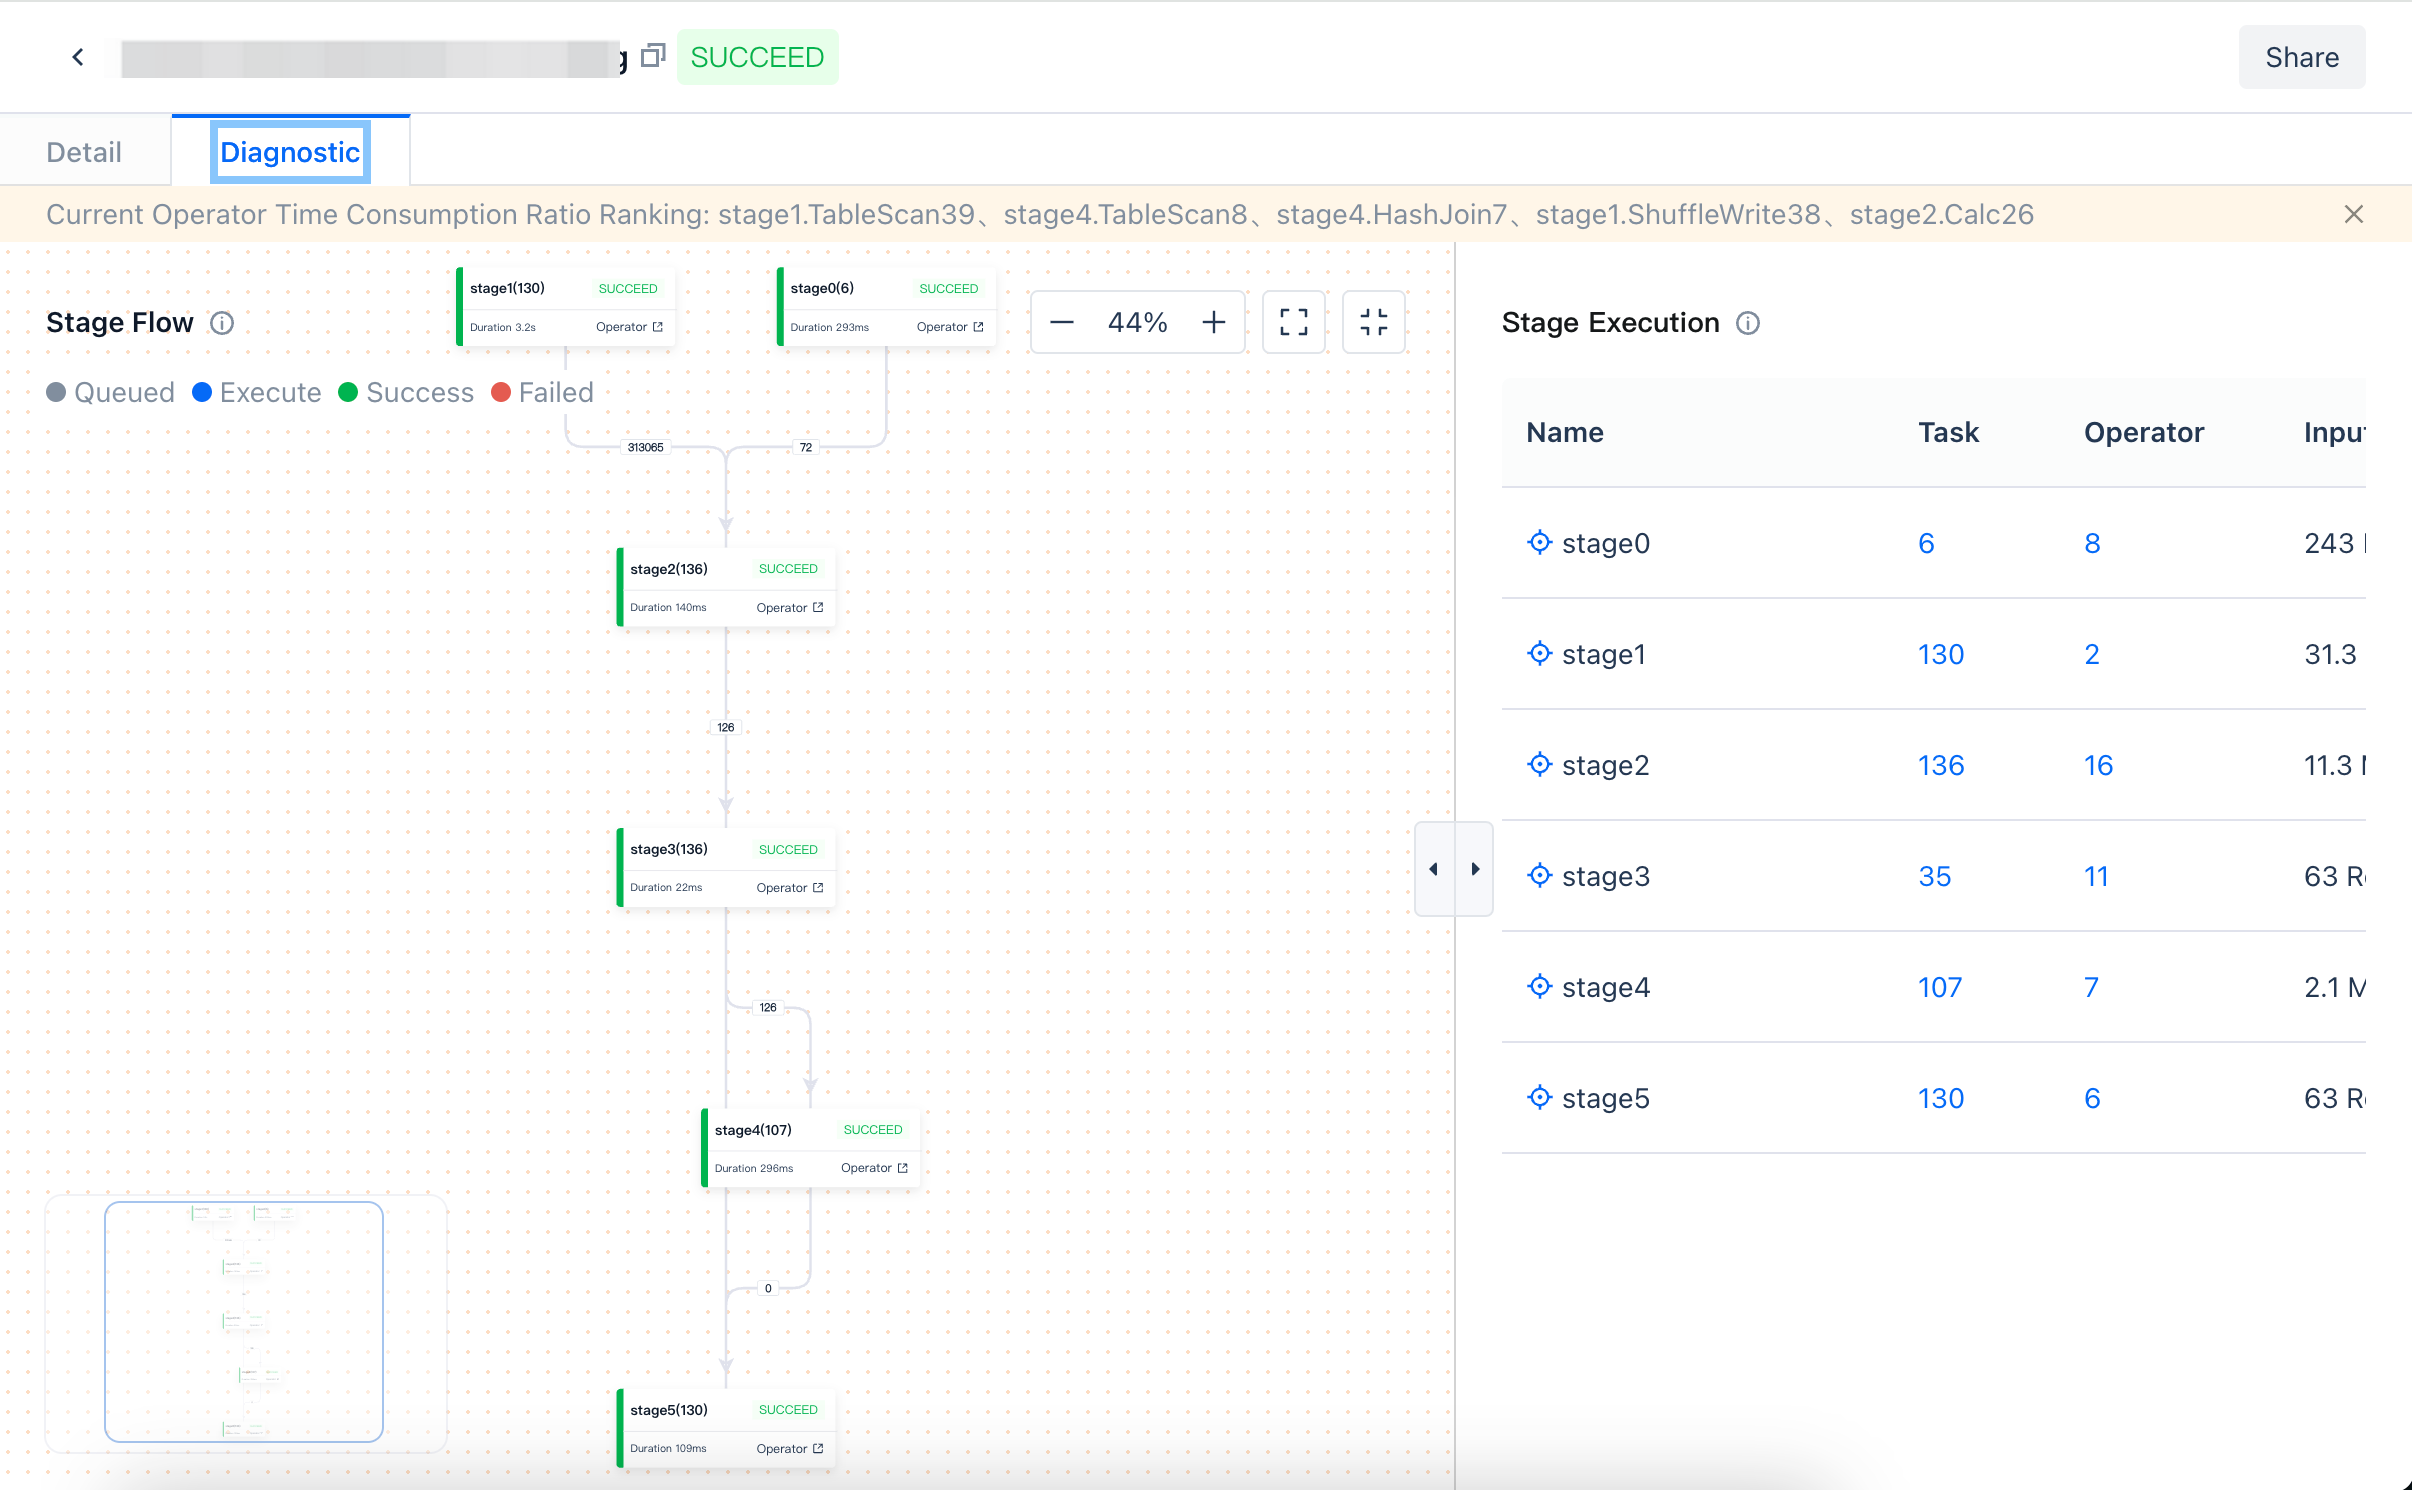
Field information is explained as follows
| Field | Description |
| Status | Indicates the status of the job, currently includes: Waiting for execution: waiting for resources Executing: running, the job is processing data Execution successful: job ran successfully Execution failed: job ran unsuccessfully |
| Start Time | The start time of the stage, stages in the analytical cluster will run simultaneously |
| End Time | The end time of the job |
| Duration | The duration of the stage running |
| Spilled to Disk | The size of the data spilled to disk, this parameter can help understand if the slow performance is due to insufficient memory resources in the cluster |
| Read from Cache | In the analytical cluster, the already read data will be cached first. This speeds up computation |
| Contains Operator | Stage |
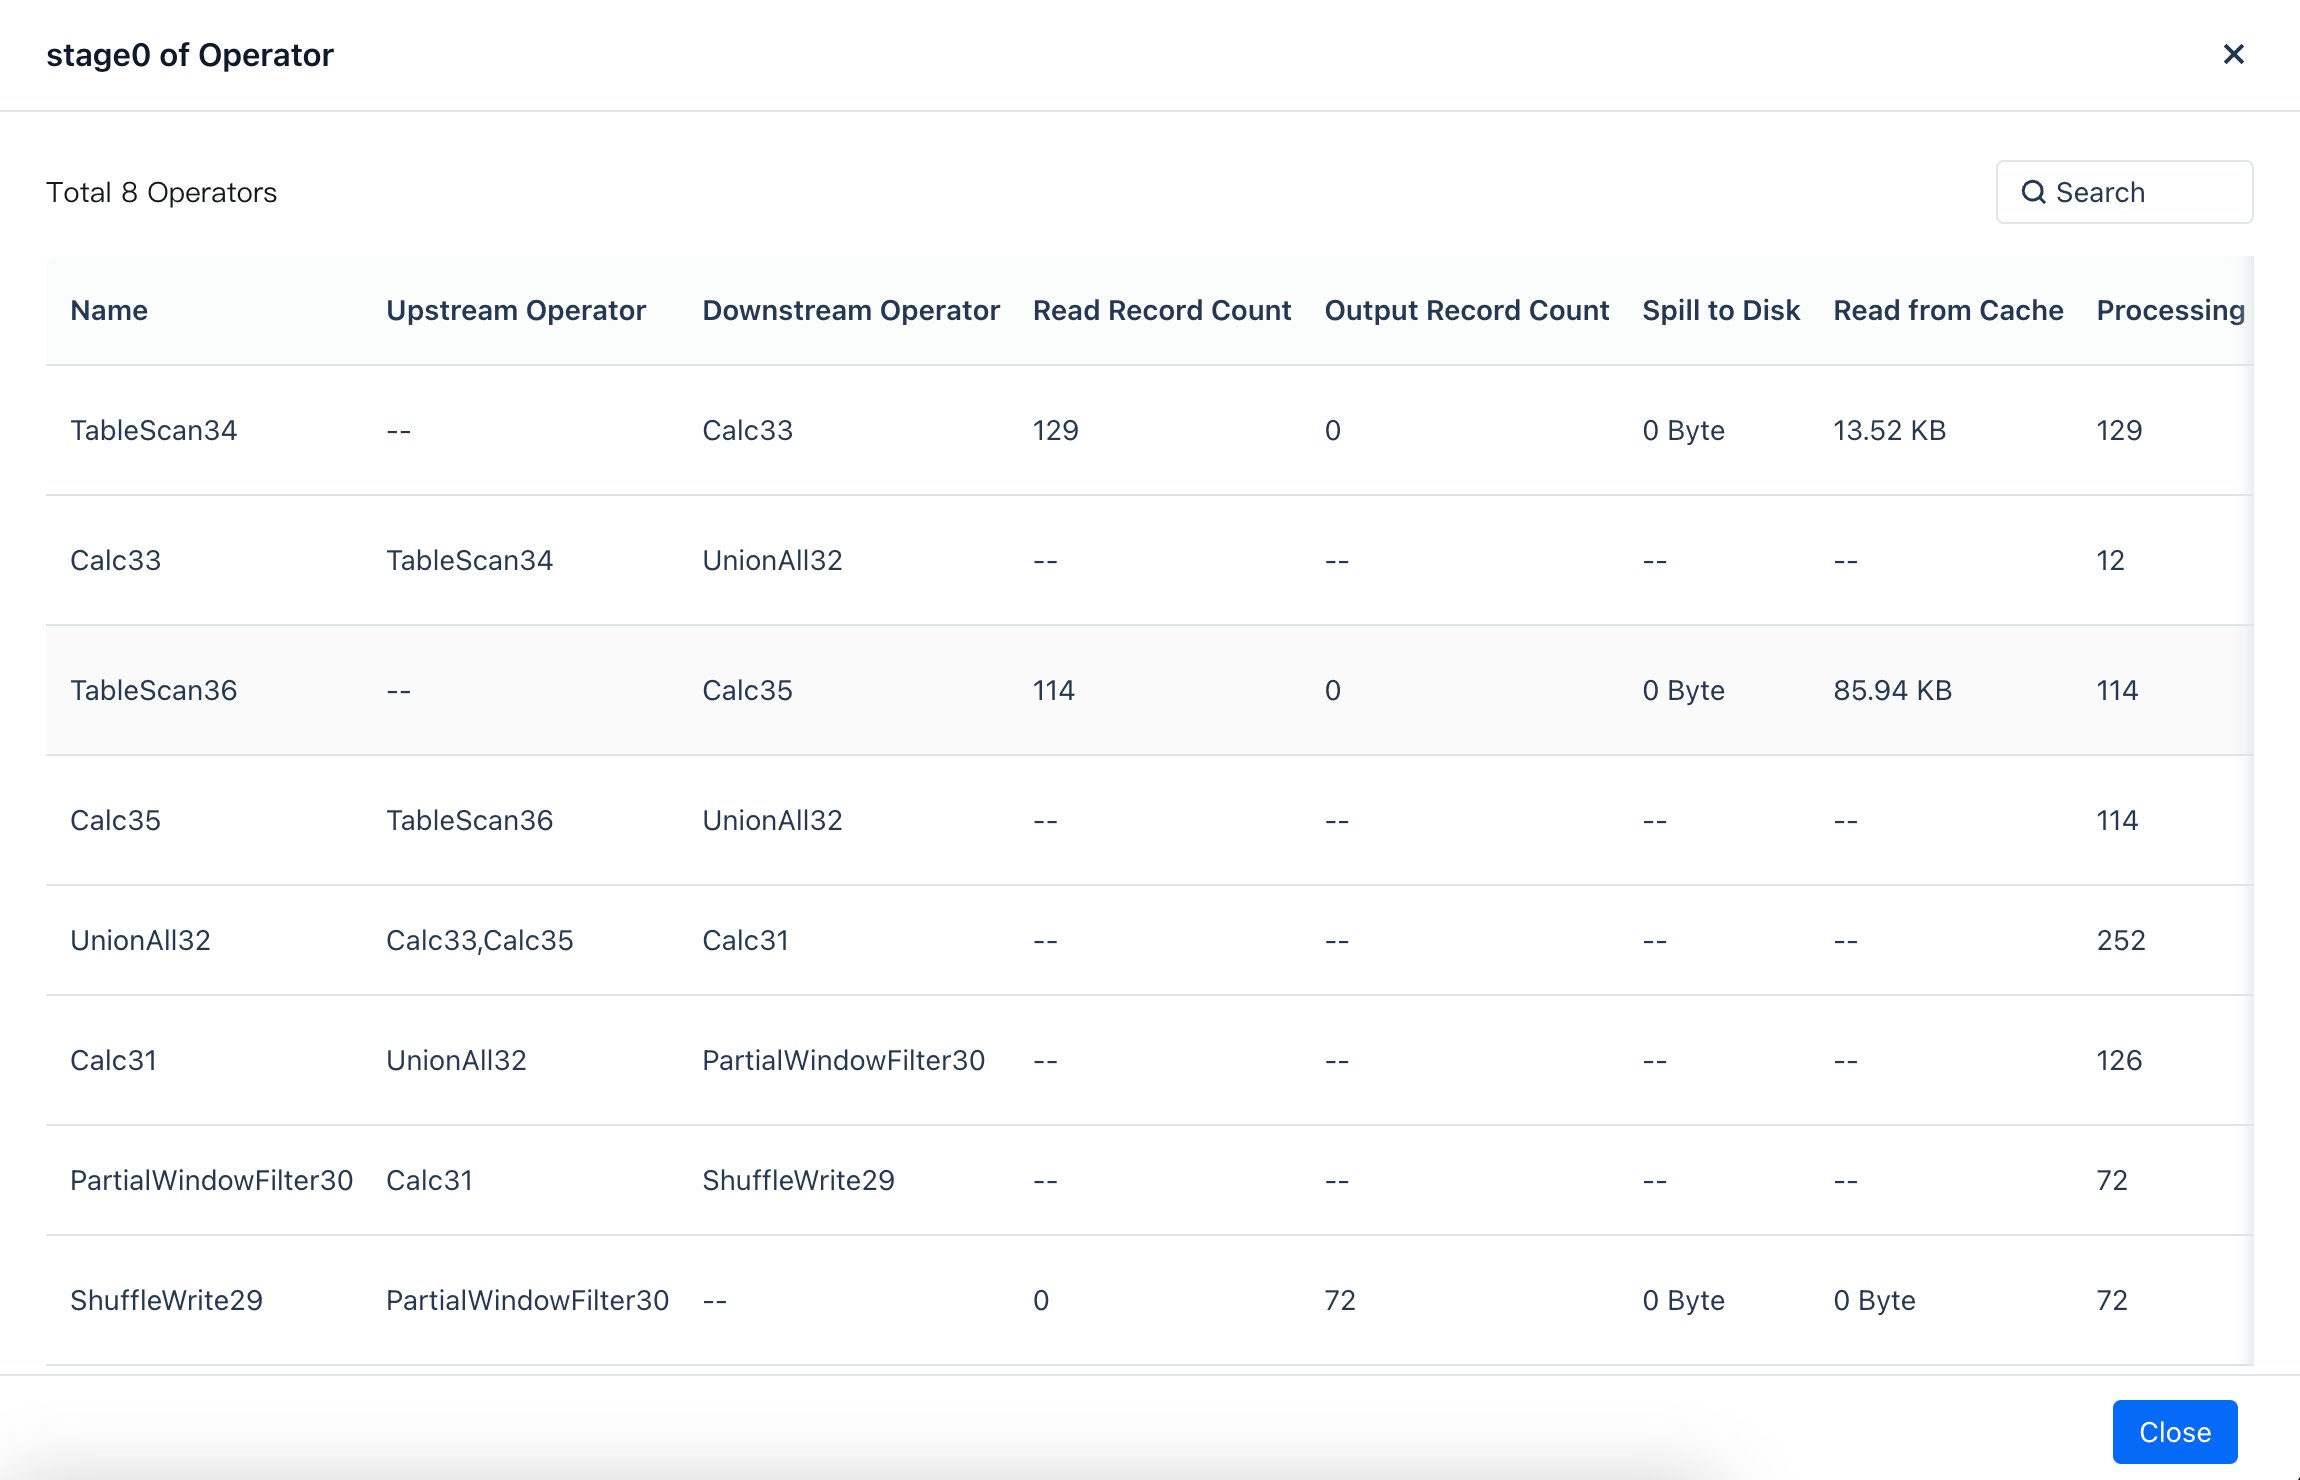
Operator Interface
In the operator interface, you can view the type of each operator and the upstream and downstream dependencies. An operator is a concept in the query plan that represents the specific steps and strategies for executing a query, including data access, transformation, and update.
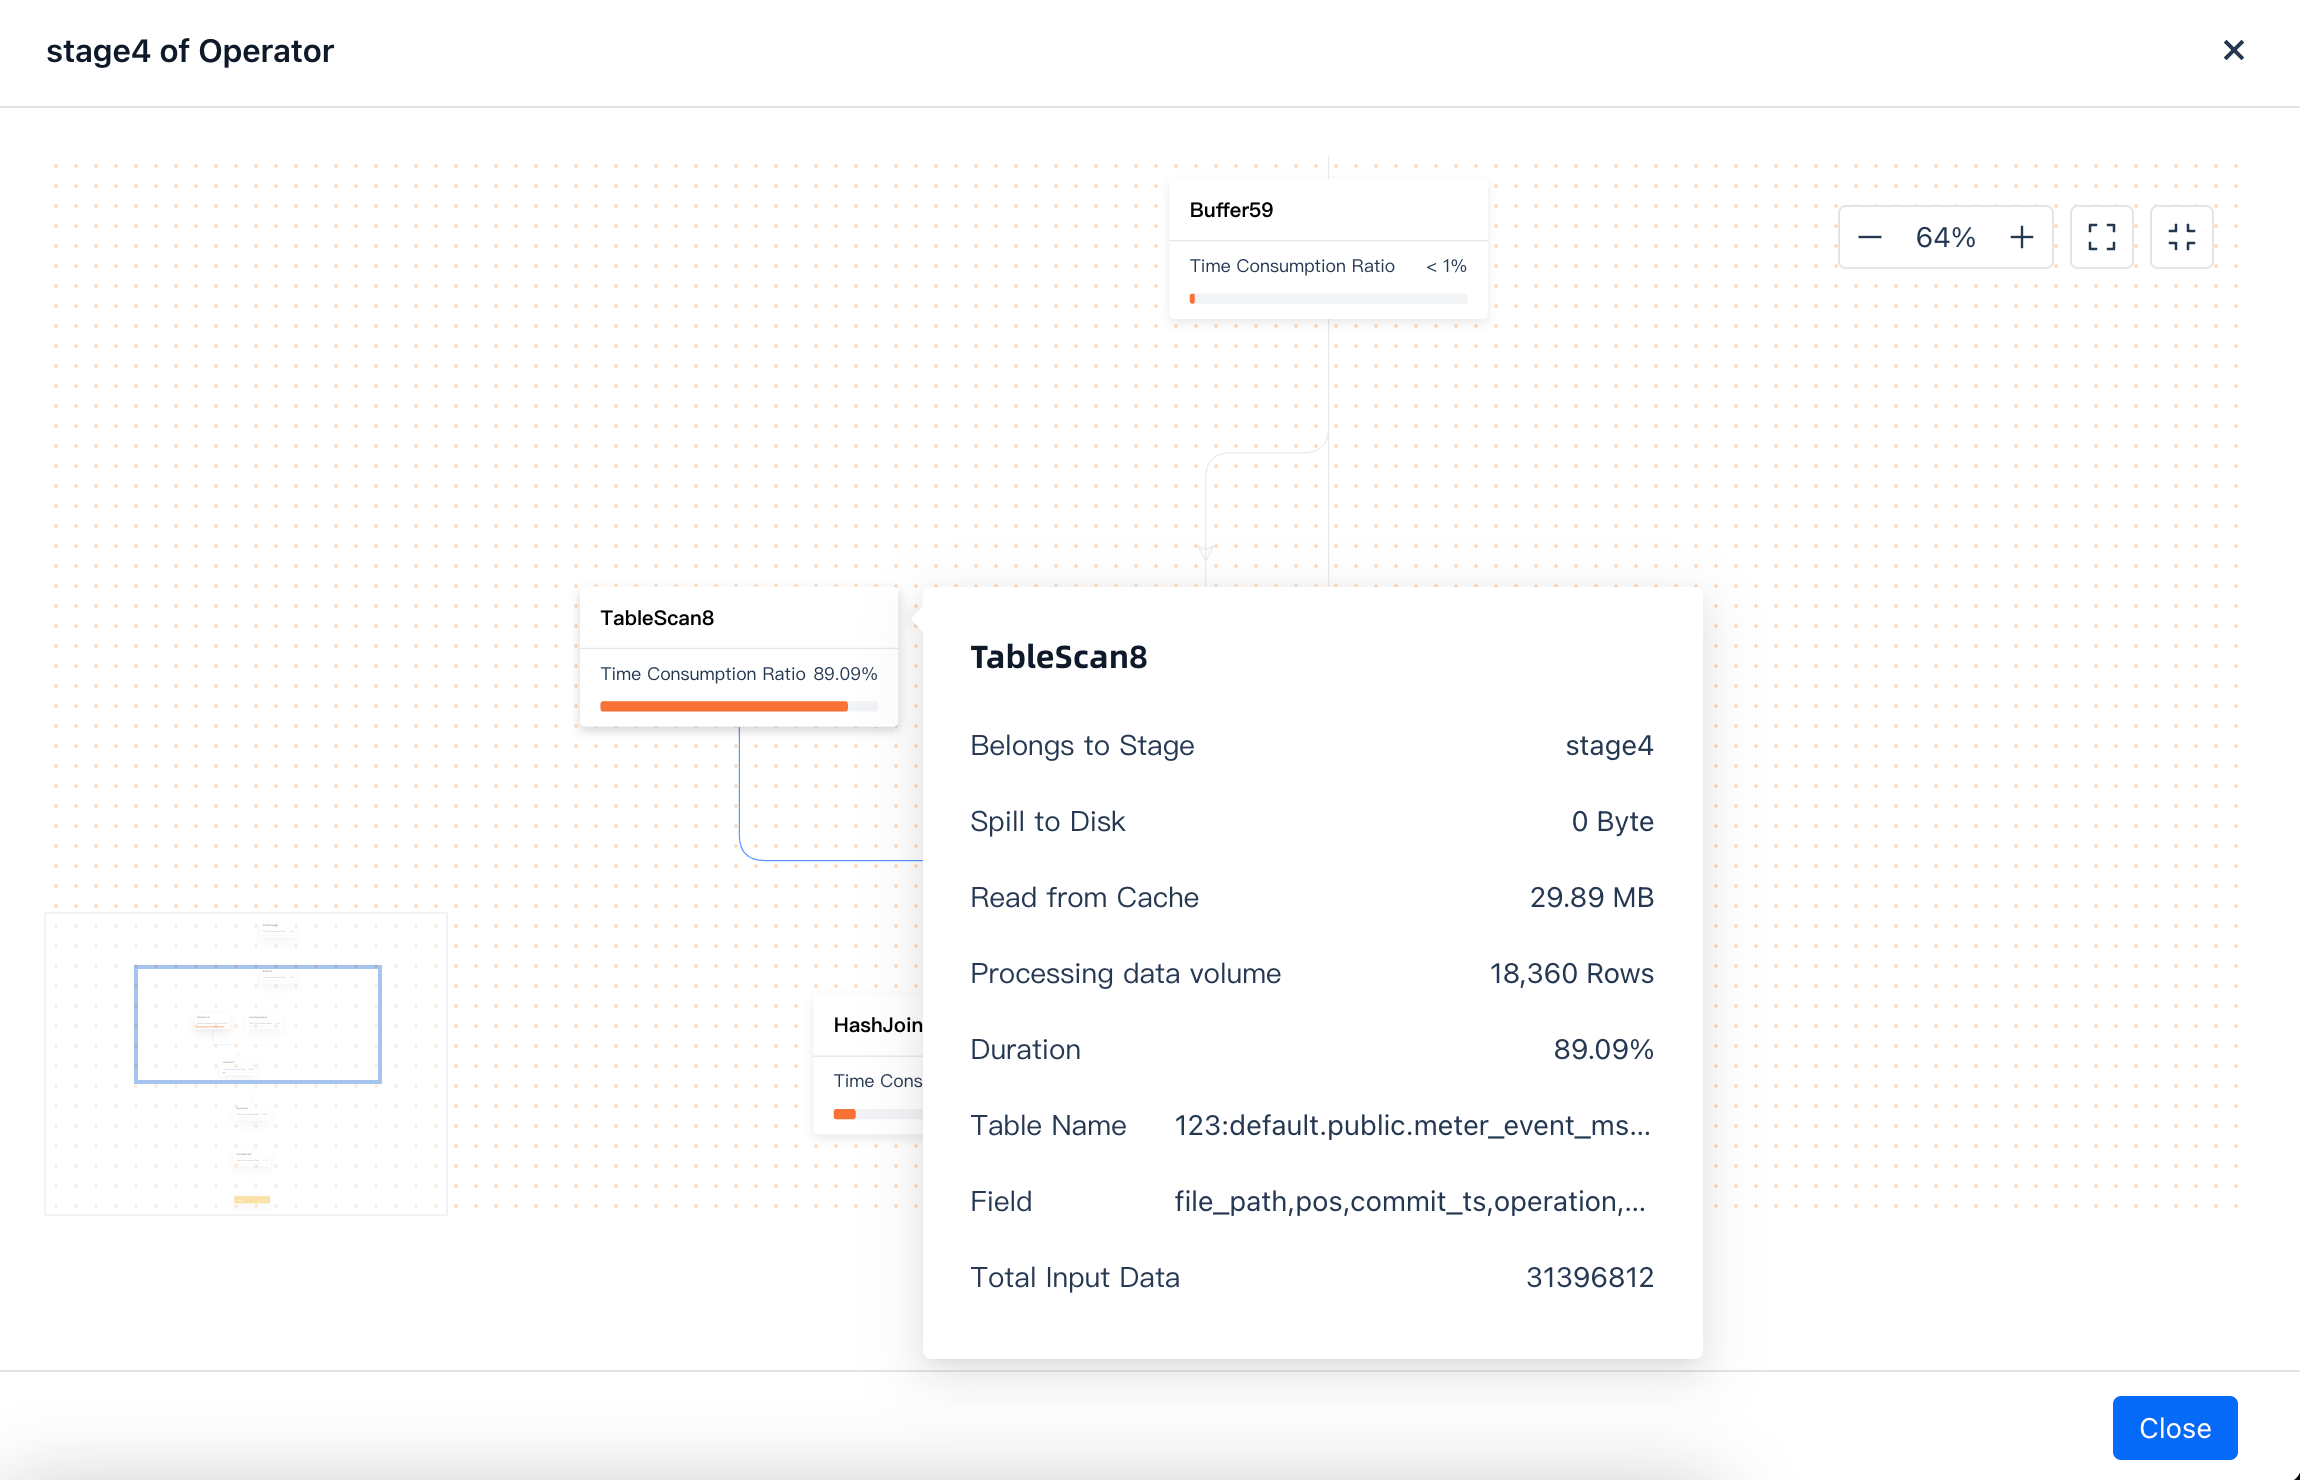
Field information is explained as follows
| Belongs to Stage | The stage corresponding to the operator |
| Spilled to Disk | The size of the data spilled to disk, this parameter can help understand if the slow performance is due to insufficient memory resources in the cluster |
| Read from Cache | In the analytical cluster, the already read data will be cached first. This speeds up computation |
| Total Rows | The data currently processed by the operator |
| Time Consumed | operate will run concurrently, currently showing the average time of operate |
| Field | Corresponds to the SQL script, corresponding field |
Table Mode
Supports stage switching table mode
Supports operator switching table mode
Analyzing Failed Jobs
When a job fails to run, you can view the reason for the failure through the details in the job profile. Here are some common failure reasons and solutions:
SQL Syntax Error
Error Example:
Error Code CZLH-42000 indicates an error related to SQL language parsing. [1,15] indicates that the error occurred on line 1, column 15 of the SQL. In this example, the reason is that the ttt table does not exist. Please note that if you submit tasks through Studio development, the job editor in development will include descriptive information, which is not submitted to the SQL engine. Therefore, the correct line number should subtract the preceding descriptive information. You can view the correct positional relationship through the job content in the job details or find the error location in the SQL editor.
Analyzing Slow Running Jobs
Slow running jobs may encounter issues during the compilation phase, the virtual cluster startup phase, or the execution phase. Below are the analyses and solutions for these phases:
Compilation Phase
Issue: Job status shows "Preparing to execute".
Possible Causes and Solutions:
- Complex execution plan: The job may require a long time to optimize. Please be patient; it should not take more than 10 minutes under normal circumstances.
- Compilation resources are fully occupied: If you submit a large number of SQLs at once, it may lead to insufficient compilation resources. Please reduce the frequency of SQL submissions. If you have a large number of high-concurrency query requirements, please submit a ticket for assistance.
Virtual Cluster Startup Phase
Issue: Job status shows "Cluster starting". The current status is that the computing cluster is being started.
Waiting Execution Phase
Issue: Job status shows "Waiting to execute".
Possible Causes and Solutions:
Insufficient computing resources in the current cluster: You can filter and view the currently running jobs through the interface. A large number of running jobs may be causing resource waiting. You can expand resources or terminate large running jobs to free up resources.
Execution Phase
Issue: Job status shows "Running". At this stage, you can click to view the execution status of each operator.
Possible Causes and Solutions:
- Waiting for resources: The job may be waiting for resource allocation. Please check the resource usage. If necessary, please submit a ticket for assistance.
- Slow data reading speed: The job may be executing slowly due to slow data reading speed. Please check the data storage and reading strategy. If necessary, optimize the data storage structure or adjust the reading strategy.
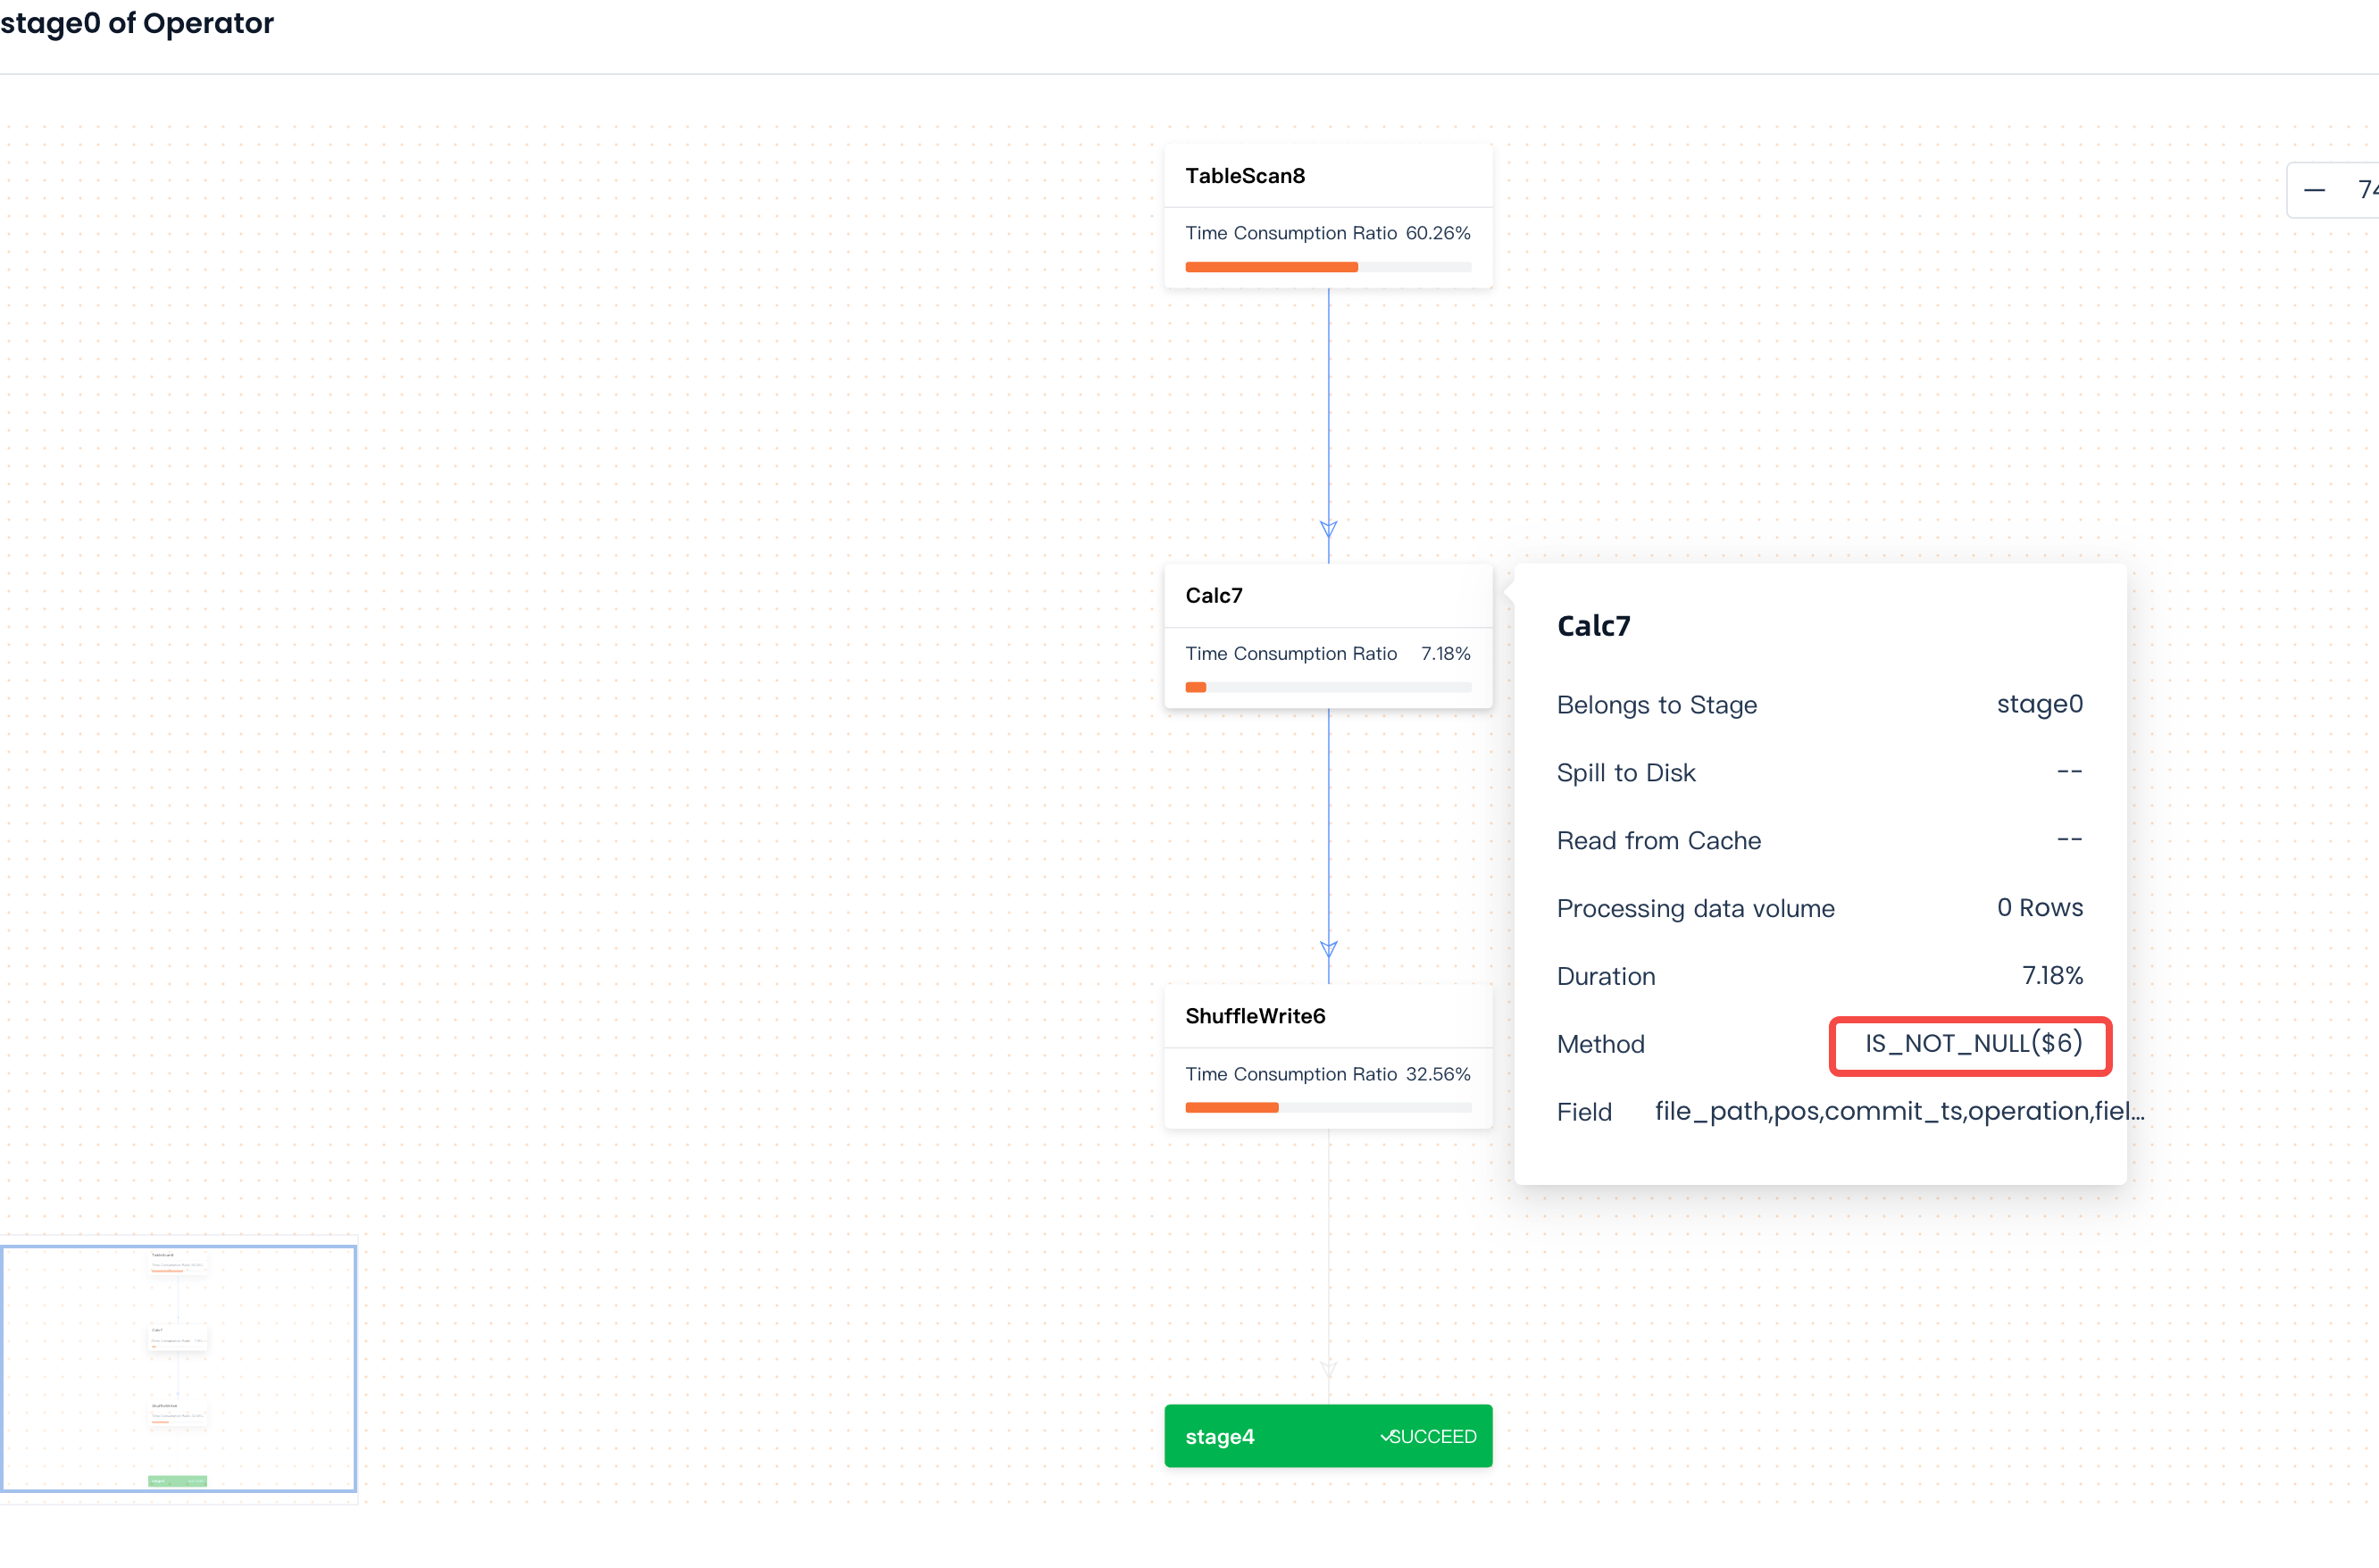
Viewing Execution Plan and Operator Details
During the execution phase, you can click on the executing operator to query specific steps and strategies. For example, moving the mouse over a specific operator can correspond to the specific operator executed in the SQL. This helps you identify which specific operator is causing the job to run slowly.
Share for Diagnosis
After entering the assignment details page, click the “Share” button to share the assignment with others. Recipients can view the content without logging in.

If you have any questions or need further assistance, please copy the link above and contact the Lakehouse team. We will diagnose and resolve the issue for you.
