Monitoring and Alerting
Overview
The monitoring function allows you to monitor abnormal situations such as task running status through built-in rules or custom configuration rules, and send alert information.
Core Concepts
| Concept | Explanation |
|---|---|
| Monitoring Rules | Refers to a set of configuration information, including specific objects and message types and other key attributes, to inform the system which key messages it is concerned about. Rules for specific objects and specific conditions will generate alert events when the conditions are met |
| Alert Events | Potential event record information that needs to send alert notifications, based on monitoring rules, when monitoring conditions are met |
| Notification History | The information record actually pushed to the user after the alert event is generated. The push of alert notifications will be affected by the following three strategies |
| Notification Strategy | Used to define what kind of notification channels, sending frequency, etc., to push to the alert recipient when pushing alerts |
Monitoring Rules
The monitoring rules list fully displays the complete list of currently configured rules. You can perform filtering and filtering operations.
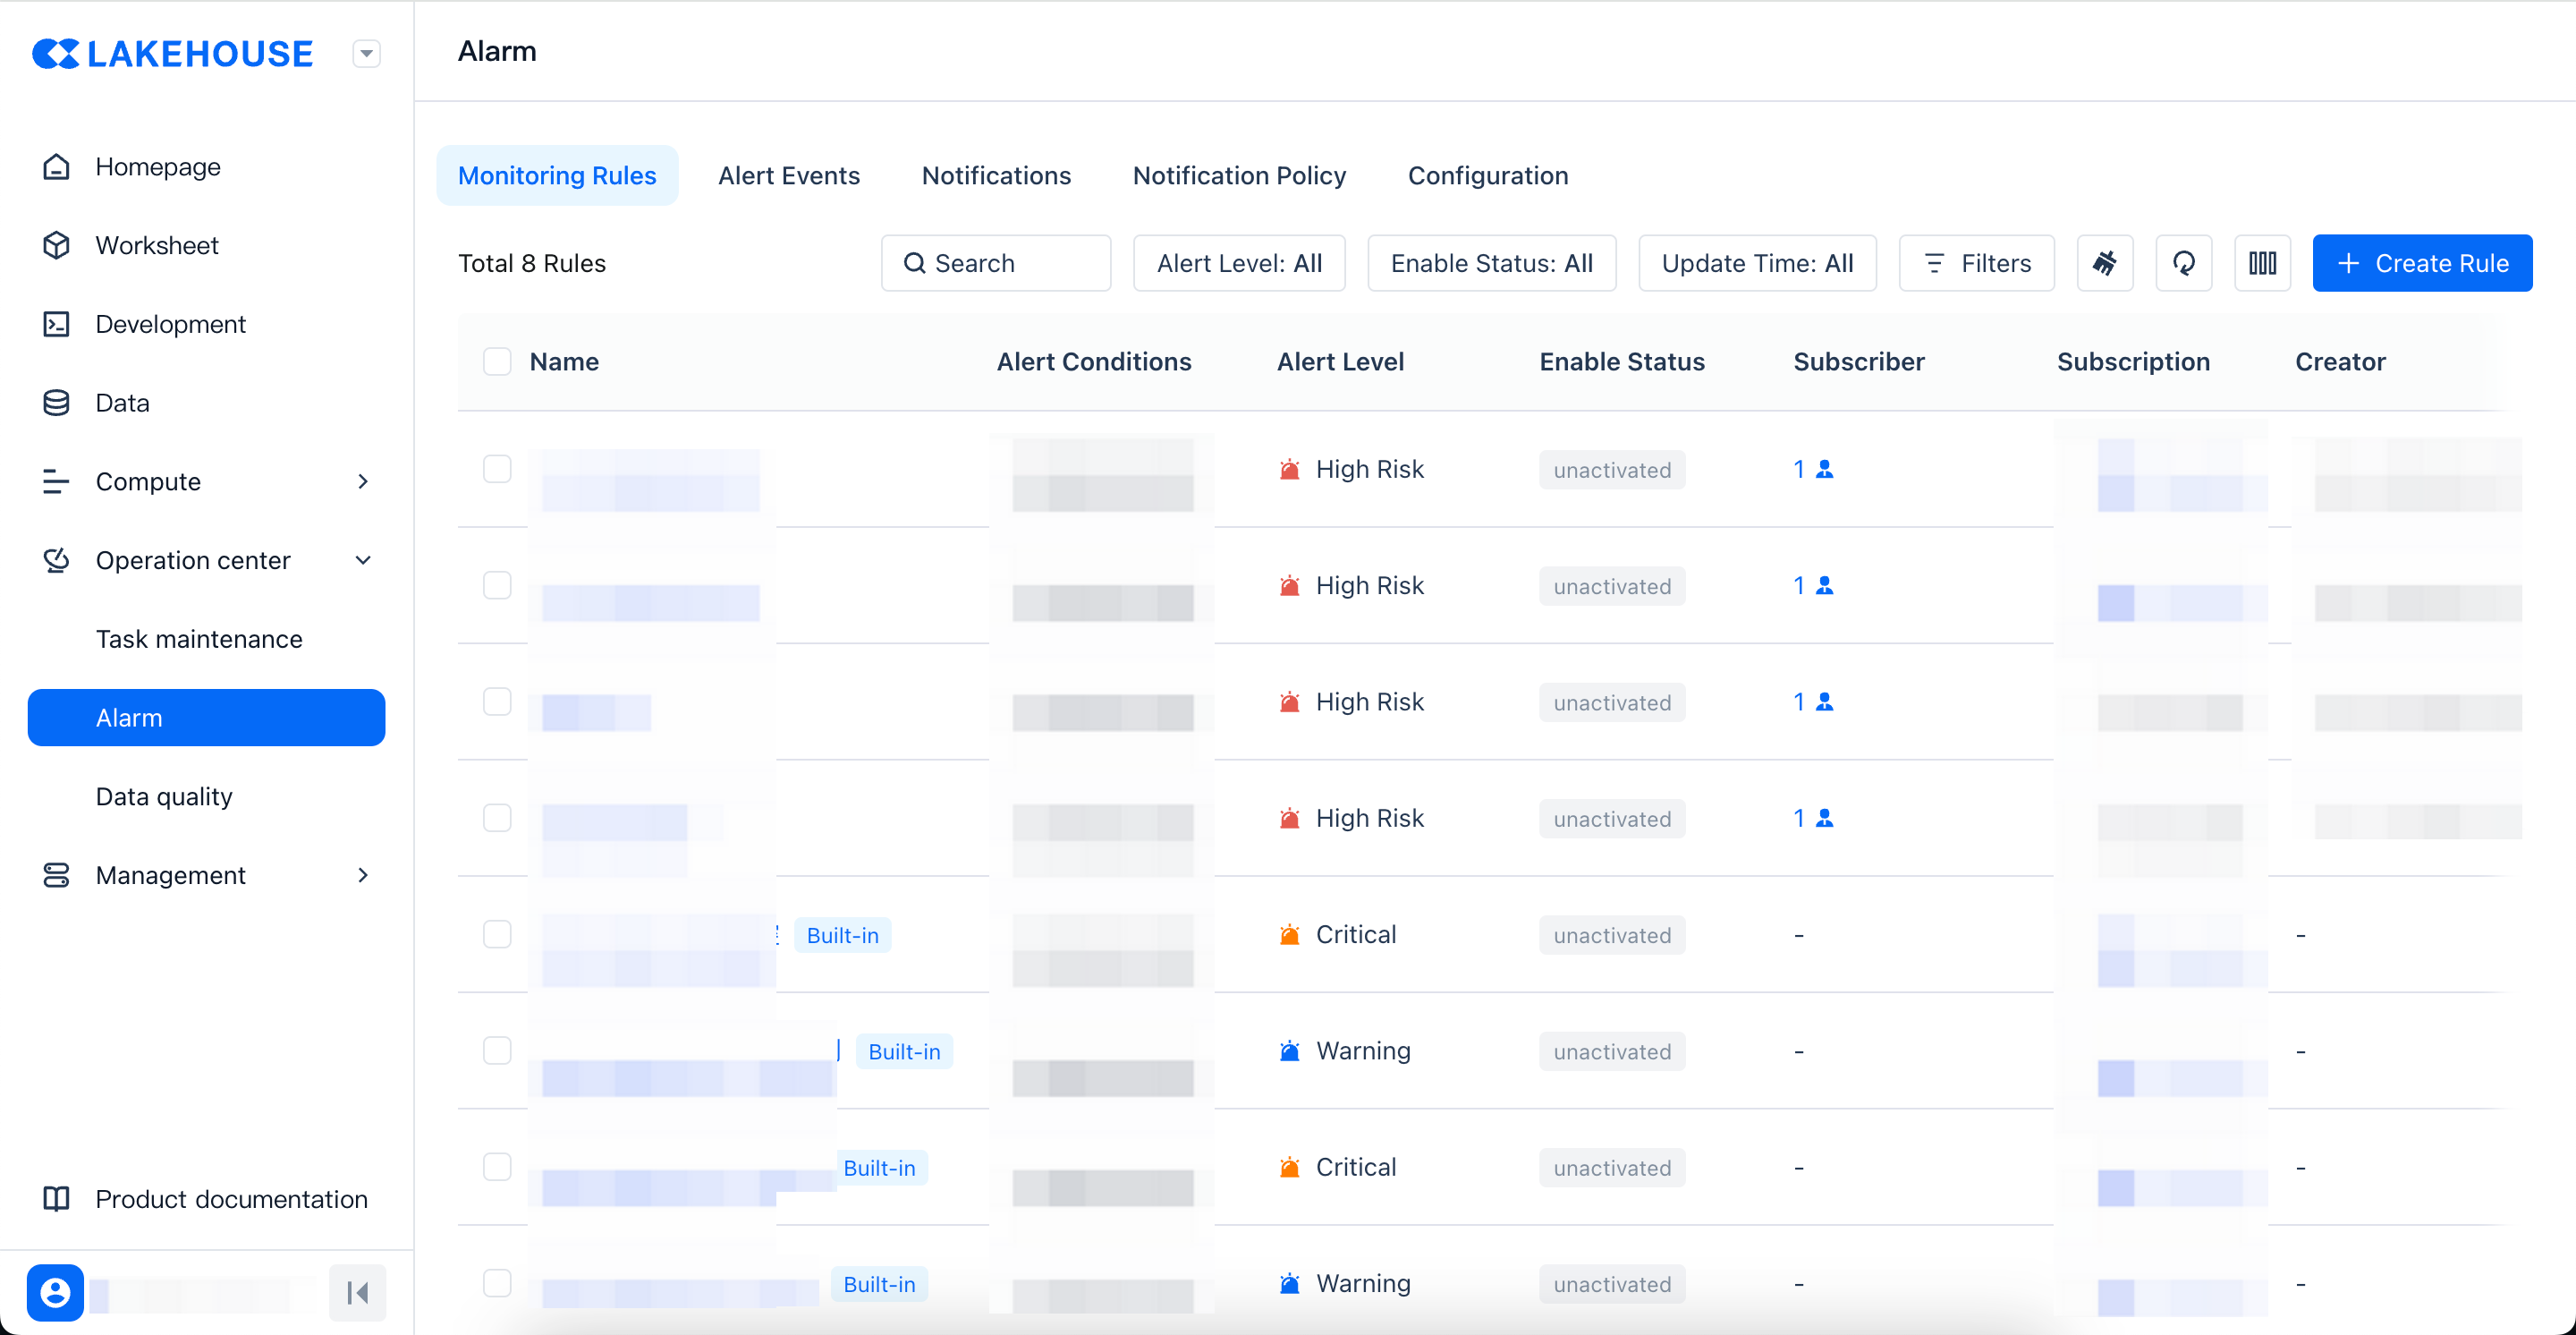
For a single rule, you can perform the following operations:
| Operation Name | Behavior Definition | Operable Personnel |
|---|---|---|
| View Details | Open the details page of the monitoring alert rule to view the complete information | Open to all instance members |
| Enable/Disable | Set the alert rule to enable or stop | Instance administrator, instance operation and maintenance role |
| Copy | Based on the current rule, copy its configuration attributes to generate new rules | Instance administrator, instance operation and maintenance role |
| Edit | Support users to modify the attributes of the monitoring rule through appropriate interaction methods | Instance administrator, instance operation and maintenance role |
| Subscribe/Unsubscribe | Add/remove the operator himself to/from the alert recipient | Open to all instance members |
Built-in System Rules
The system comes with built-in global monitoring rules that can be enabled as needed.
| Rule Name | Rule Function | Default Start/Stop Status |
|---|---|---|
| General Rule Monitoring Task Failure | The default rule for global monitoring of task instance failures, triggers monitoring alerts when the instance fails | Default off |
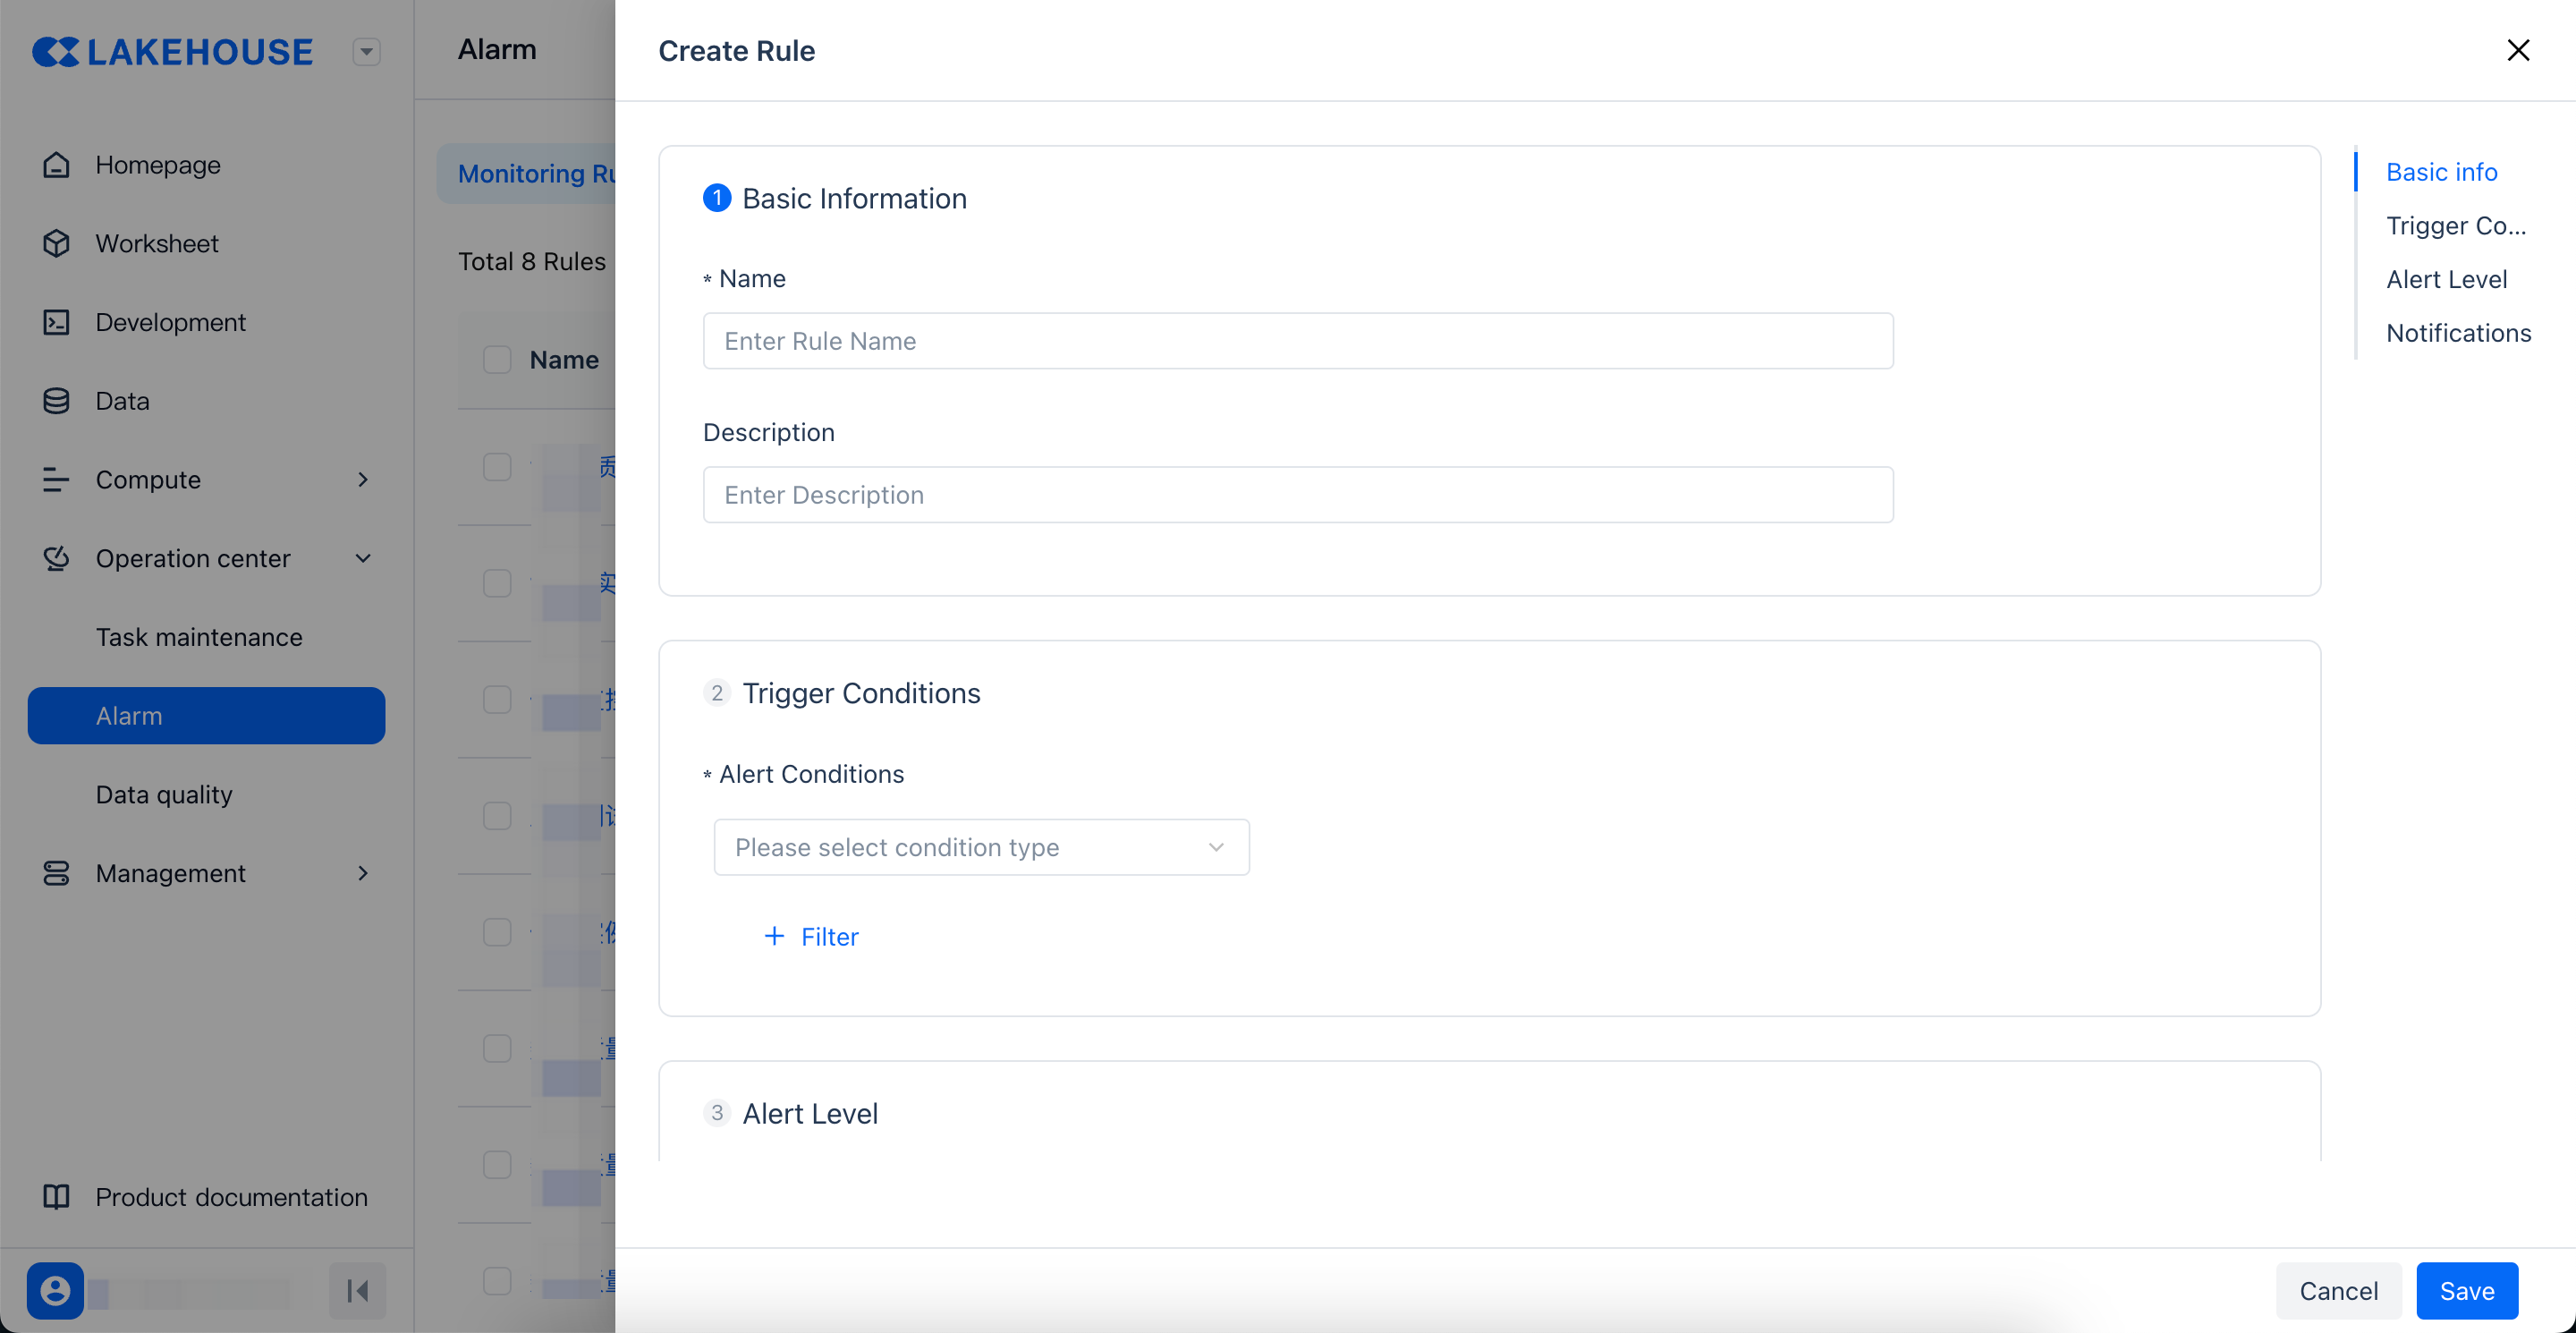
New Monitoring Rules
Click the "New Rule" button to customize and create monitoring rules as needed.
| Category | Parameter | Description |
|---|---|---|
| Basic Information | Name | Enter the name of the new custom rule. |
| Description | Not required, you can add a description of the current rule, or fill in the relevant handling methods after receiving the alert. | |
| Trigger Condition | Monitoring Items | The specific monitoring object, the current system supports "Event Monitoring" and "Metric Monitoring" two methods. |
| Filter Condition | The filter condition for messages, the relationship between multiple conditions is "and" | |
| Alert Level | Alert Level | The alert level configuration rules in the universal template are as follows, and users are also supported to customize different levels of notification methods in the notification strategy. High risk: Send using all alert channels, including phone Serious: Use all alert channels to send, including phone Warning: System internal, email, SMS, Webhook, excluding phone Reminder: System internal, email, Webhook, excluding phone, SMS Clicking on the alert level will link the information presented in the notification strategy list below. |
| Monitoring Notification | Notification Strategy | Click the drop-down box to directly select the information managed in the notification "Notification Strategy", or click the + sign to create a new notification strategy. For the specific configuration of the notification strategy, see the notification strategy |
| Alert Subscription | Drop-down selection of the specific person who needs to be notified for this rule | |
| Webhook Notification | Choose the notification method, the currently supported notification types are DingTalk Feishu | |
| Notification Start Time | The start time for sending notifications after the monitoring rule is triggered | |
| Notification End Time | The end time for sending notifications after the monitoring rule is triggered |
Trigger Condition Rules
The trigger condition refers to the combination of the corresponding metric calculation method, threshold, and trigger method after the user has selected a specific monitoring item. The current product supports users to customize the configuration of "Event Monitoring" and "Metric Monitoring".
"Metric" monitoring configuration
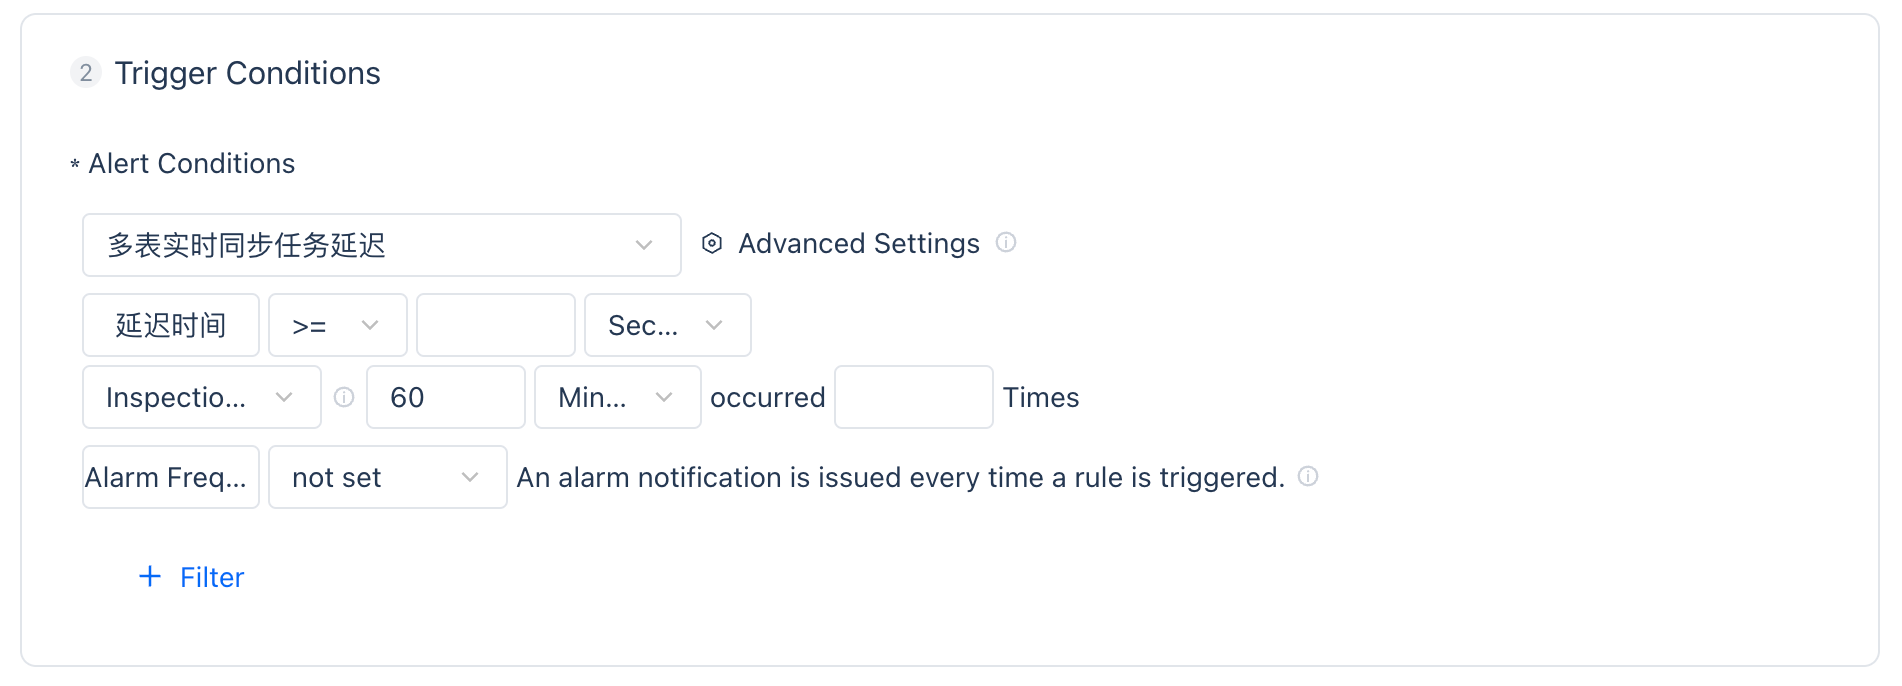
For the metric monitoring type, after defining the calculation method and threshold, two trigger methods are supported.
Continuous: Once the metric touches the threshold continuously N times, it will trigger a monitoring alert.
Check Interval: Users need to define that after accumulating N times within the check interval range, it will trigger a monitoring alert.
For example: The user has configured the delay indicator of the full-incremental integrated synchronization task, the delay event>=50s, continuous 3 data points, and the alert frequency limit is sent once every 30 minutes.
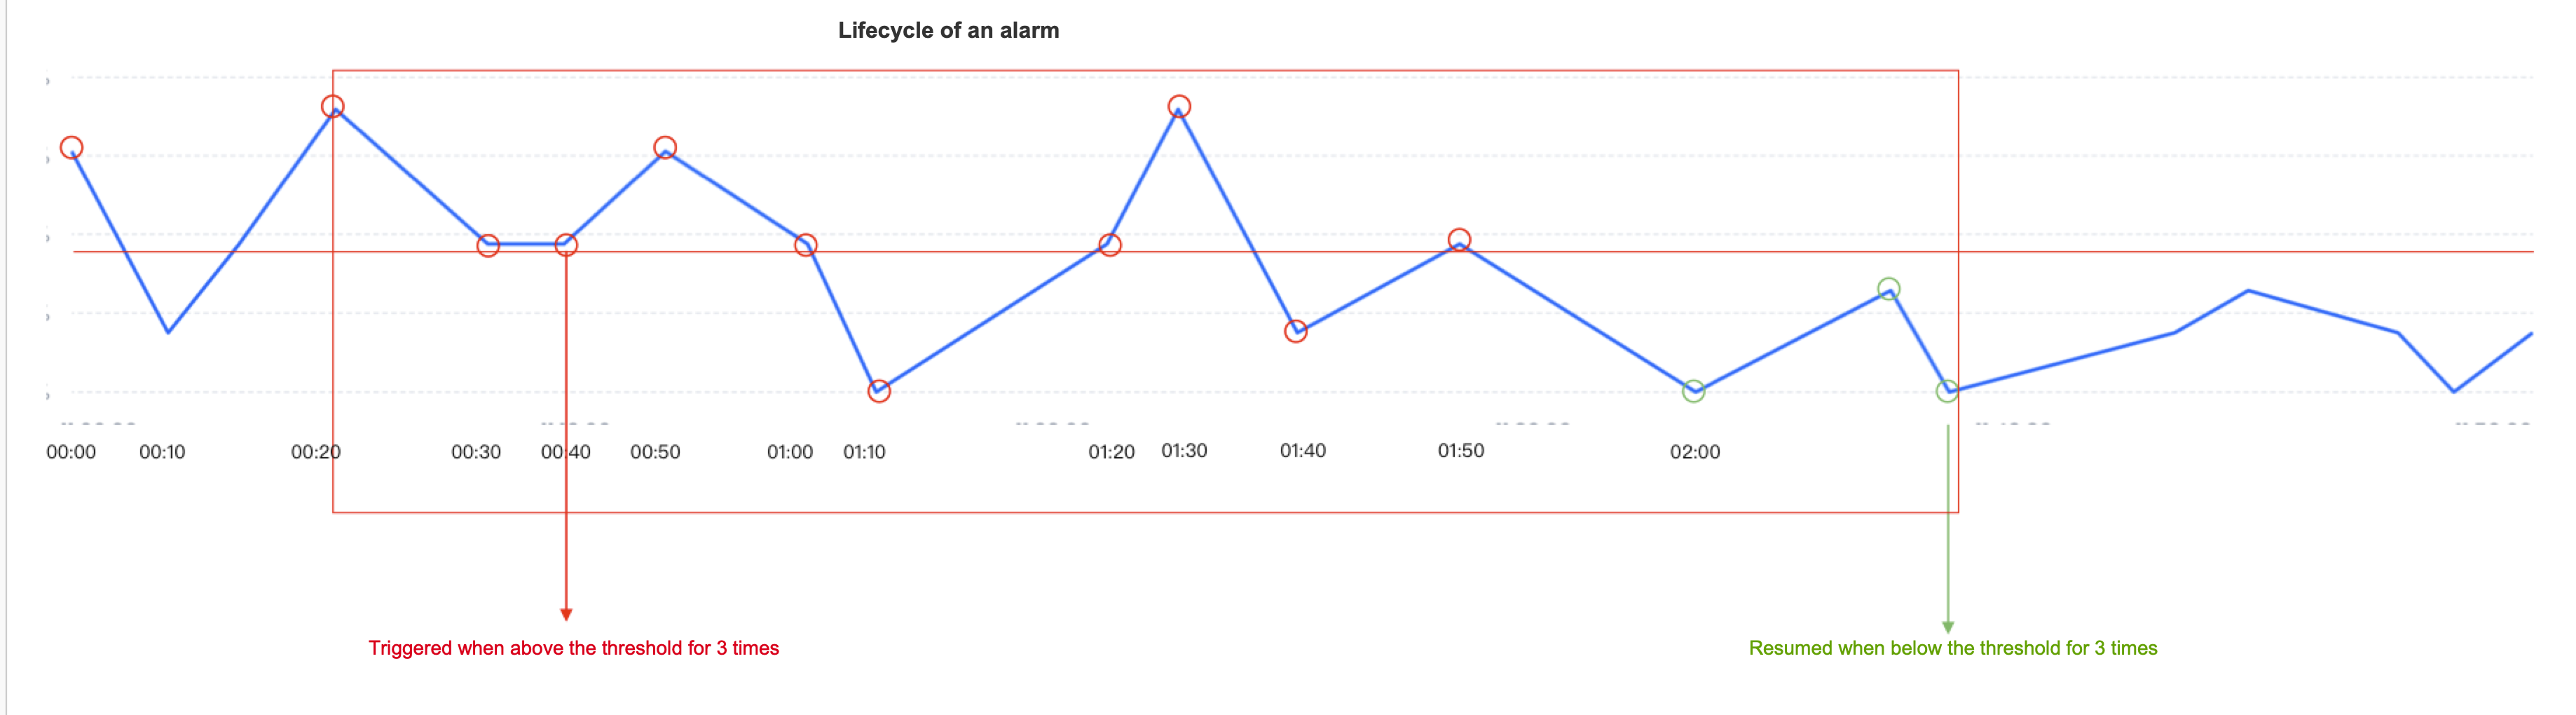
At 00:40, it was found that it was above the threshold for 3 consecutive times, and the first alert was triggered. From then until 01:50, it was in the first alert stage.
During the alert stage, the next few time points are judged by the alert frequency, and the alert is continuously sent based on the configuration of the alert frequency. The alert limit is sent once every 30 minutes, so it will send alert notifications at 01:10 and 01:40.
Starting from 02:00, the next three indicators are all below the threshold, so the first alert is restored and no more alert notifications are triggered.
If the user's trigger method is to check the cumulative number of times in the monitoring.
"Event" monitoring configuration
Event monitoring is an alert generated when a specific event or condition occurs. Users can monitor based on the operation and maintenance instances or data quality check rules currently supported in the product. Based on the current behavior supported in the product, the current event monitoring is mainly divided into two categories:
Task Operation and Maintenance: Users configure various types of cycle scheduling tasks defined in the development scenario through the scheduling scenario, or real-time running task instances.
Data Quality: The various table quality monitoring configured by users in data quality.
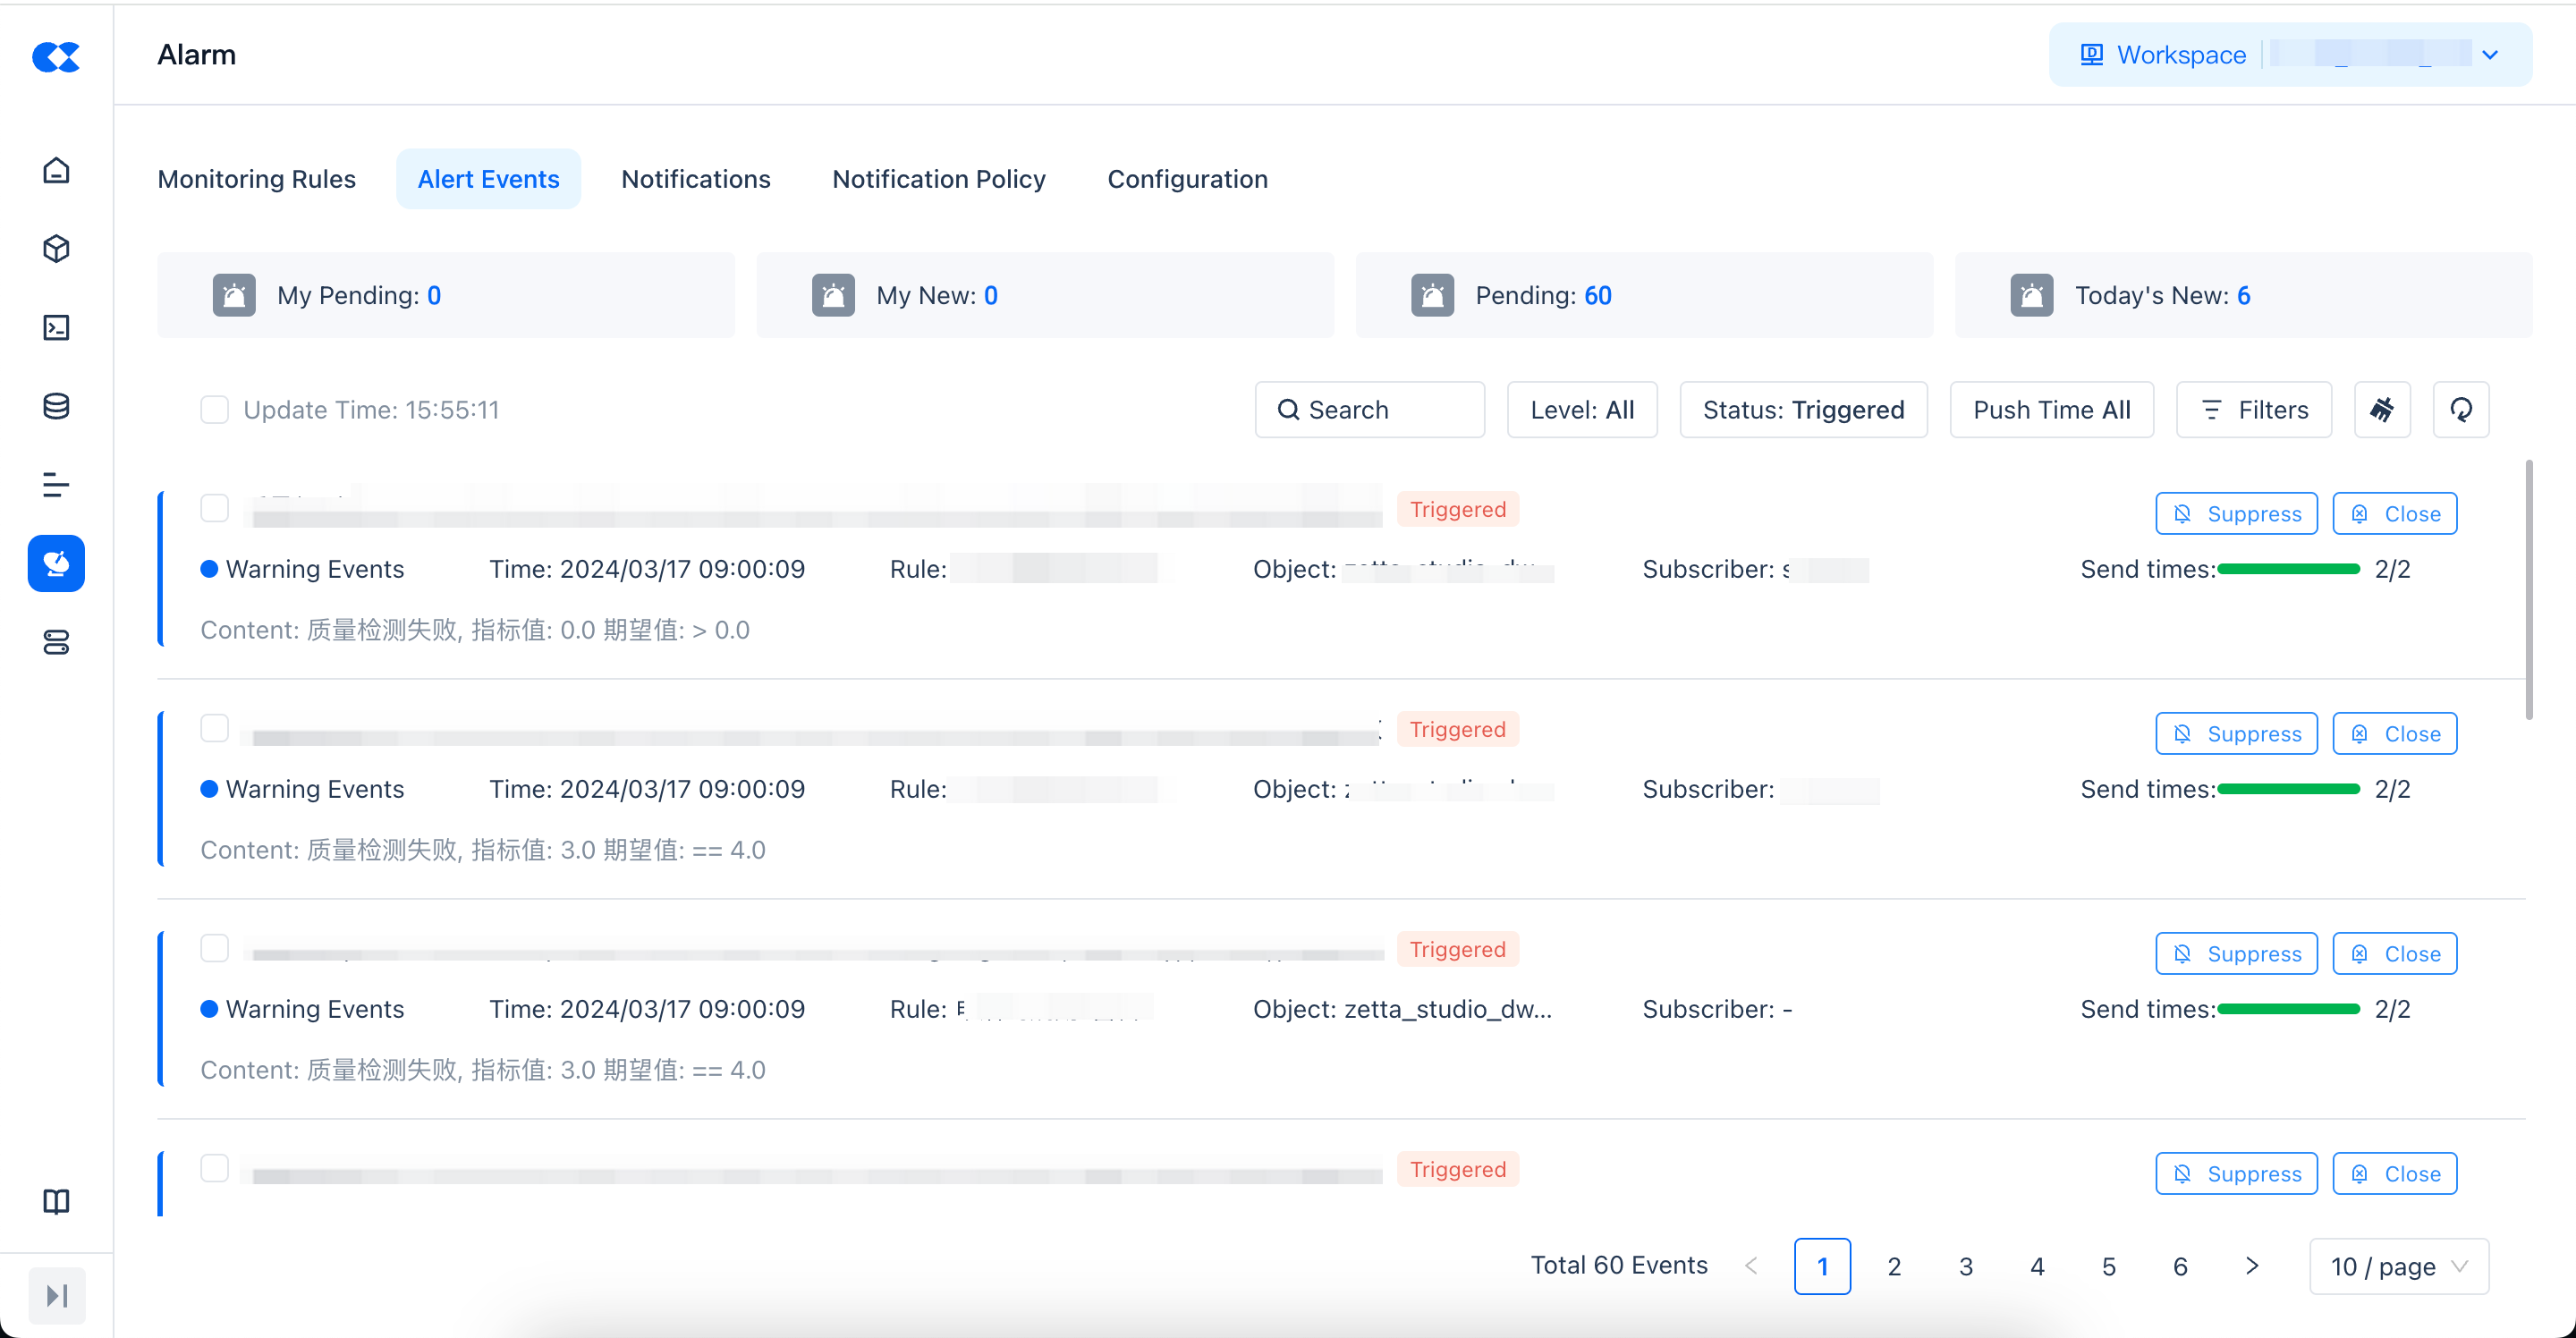
Alert Events
The alert event list displays all the specific alert information after triggering the monitoring rule under the current instance, and can perform the following operations on the alert events in the current list:
Suppress: Set the current alert event to not send messages again within a few minutes.
Close: Close the current alert event and no longer receive such messages.
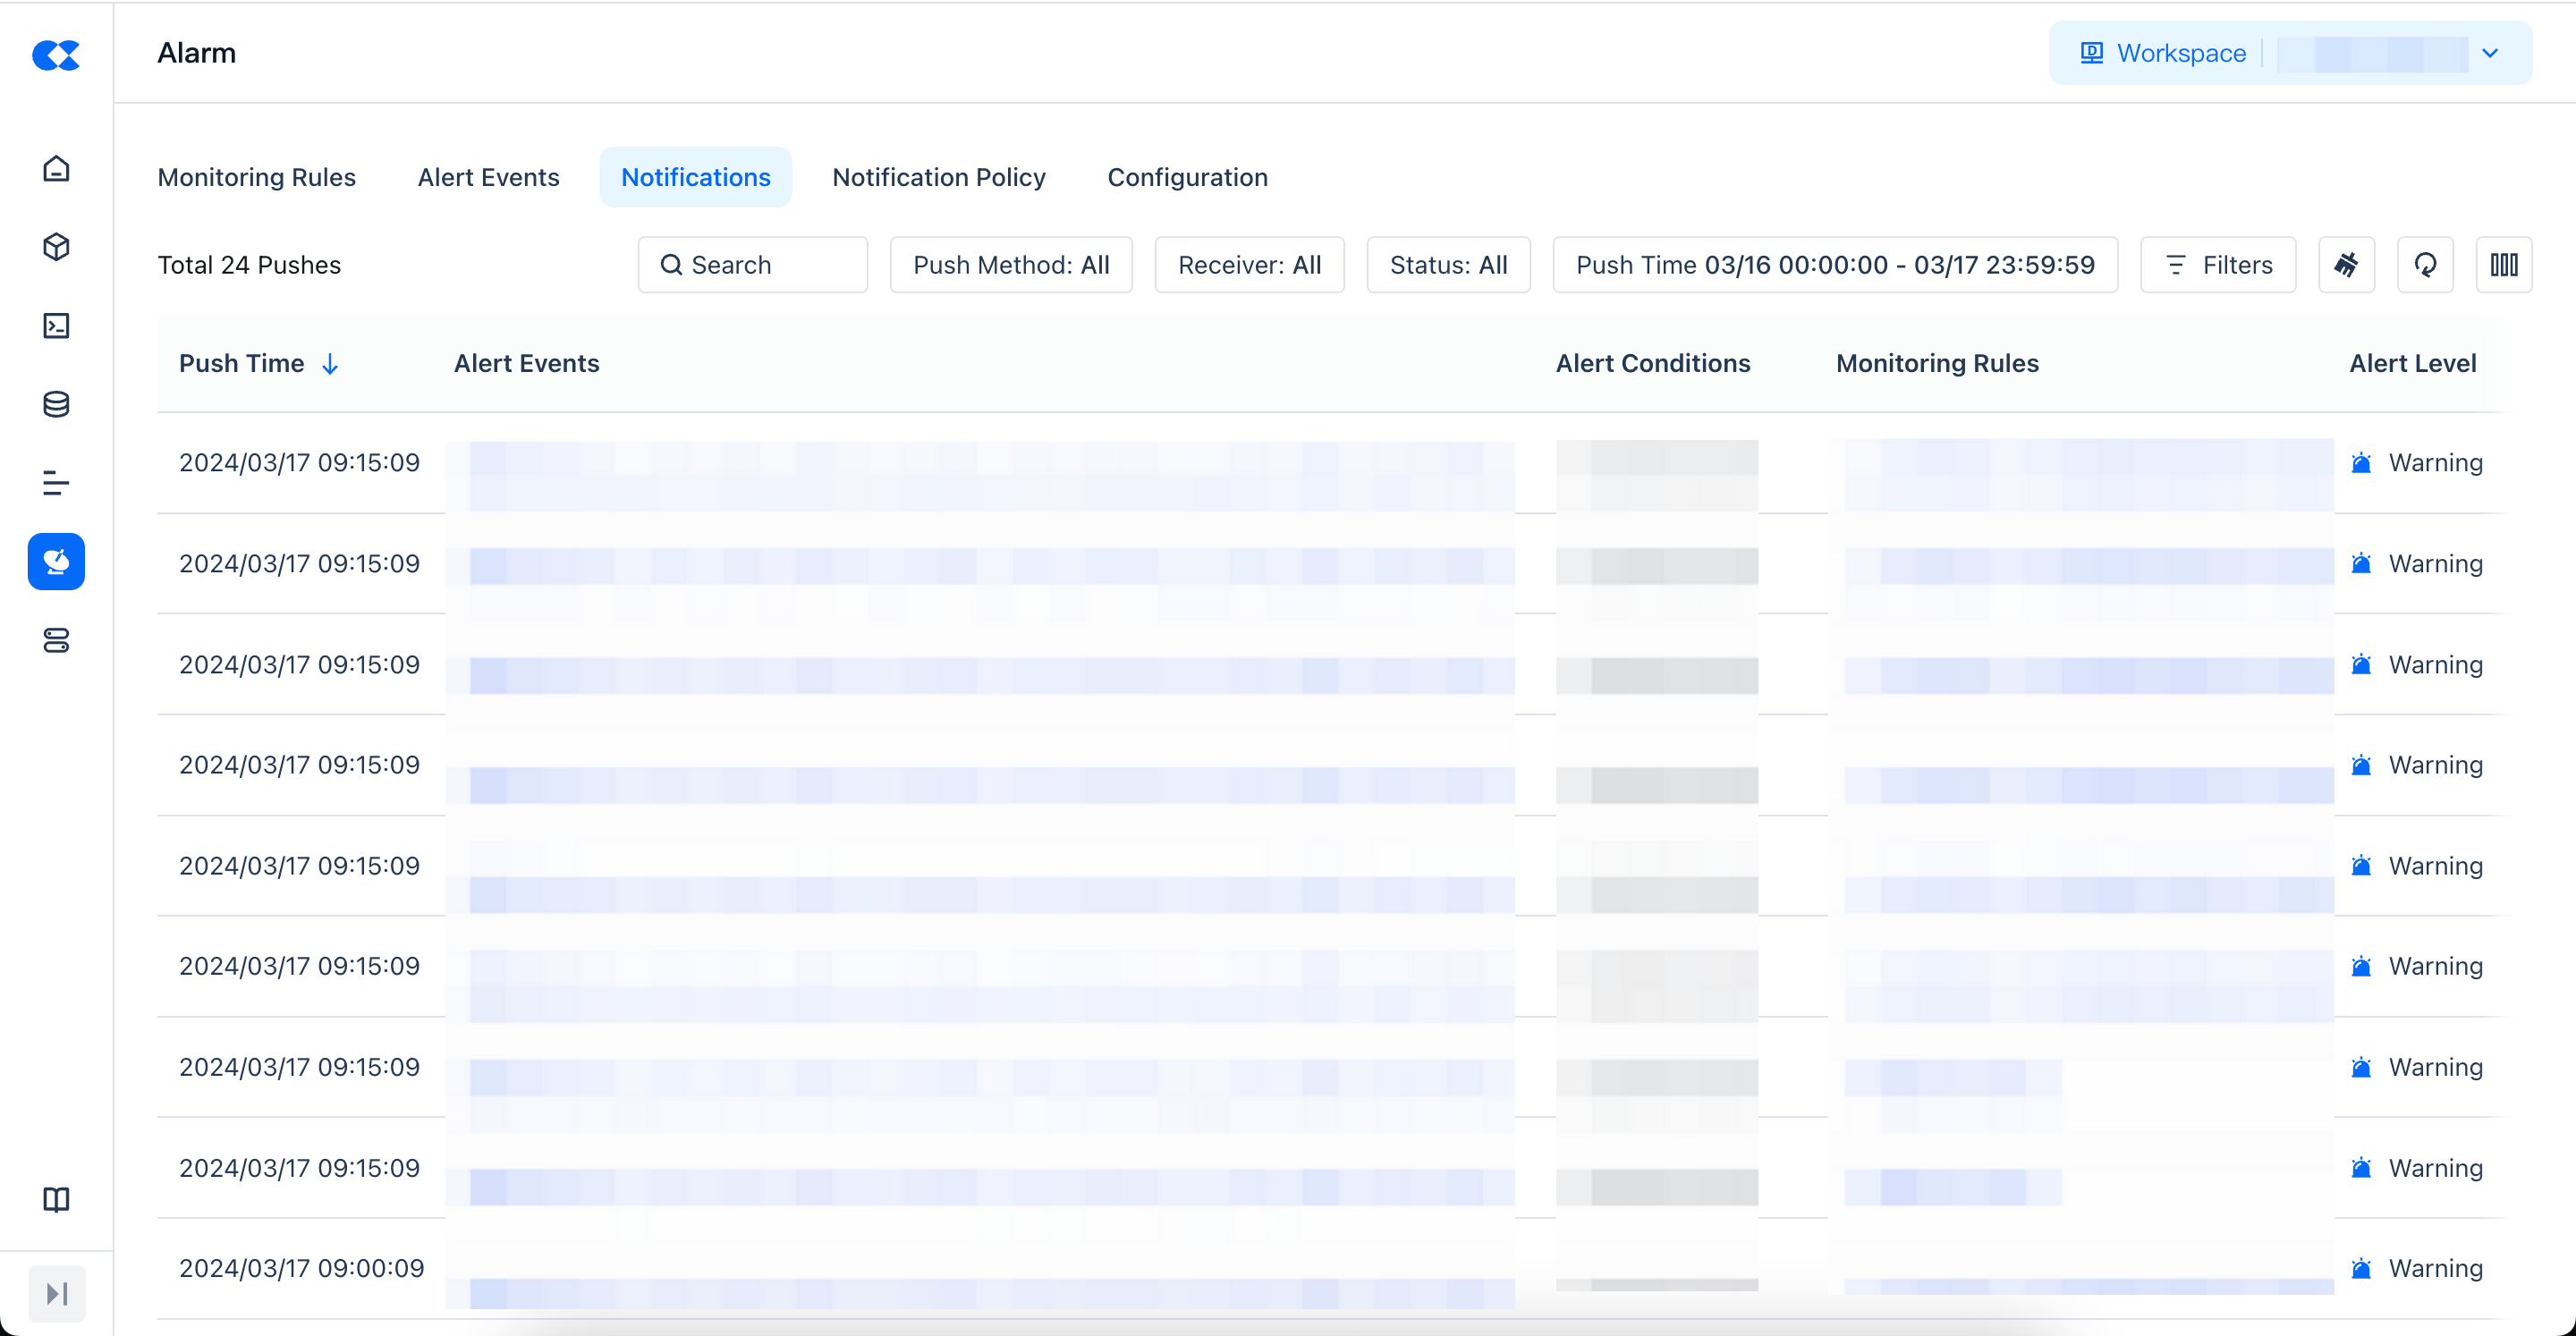
Notification History
All message notifications that actually arrive based on the notification strategy after the alert is triggered.
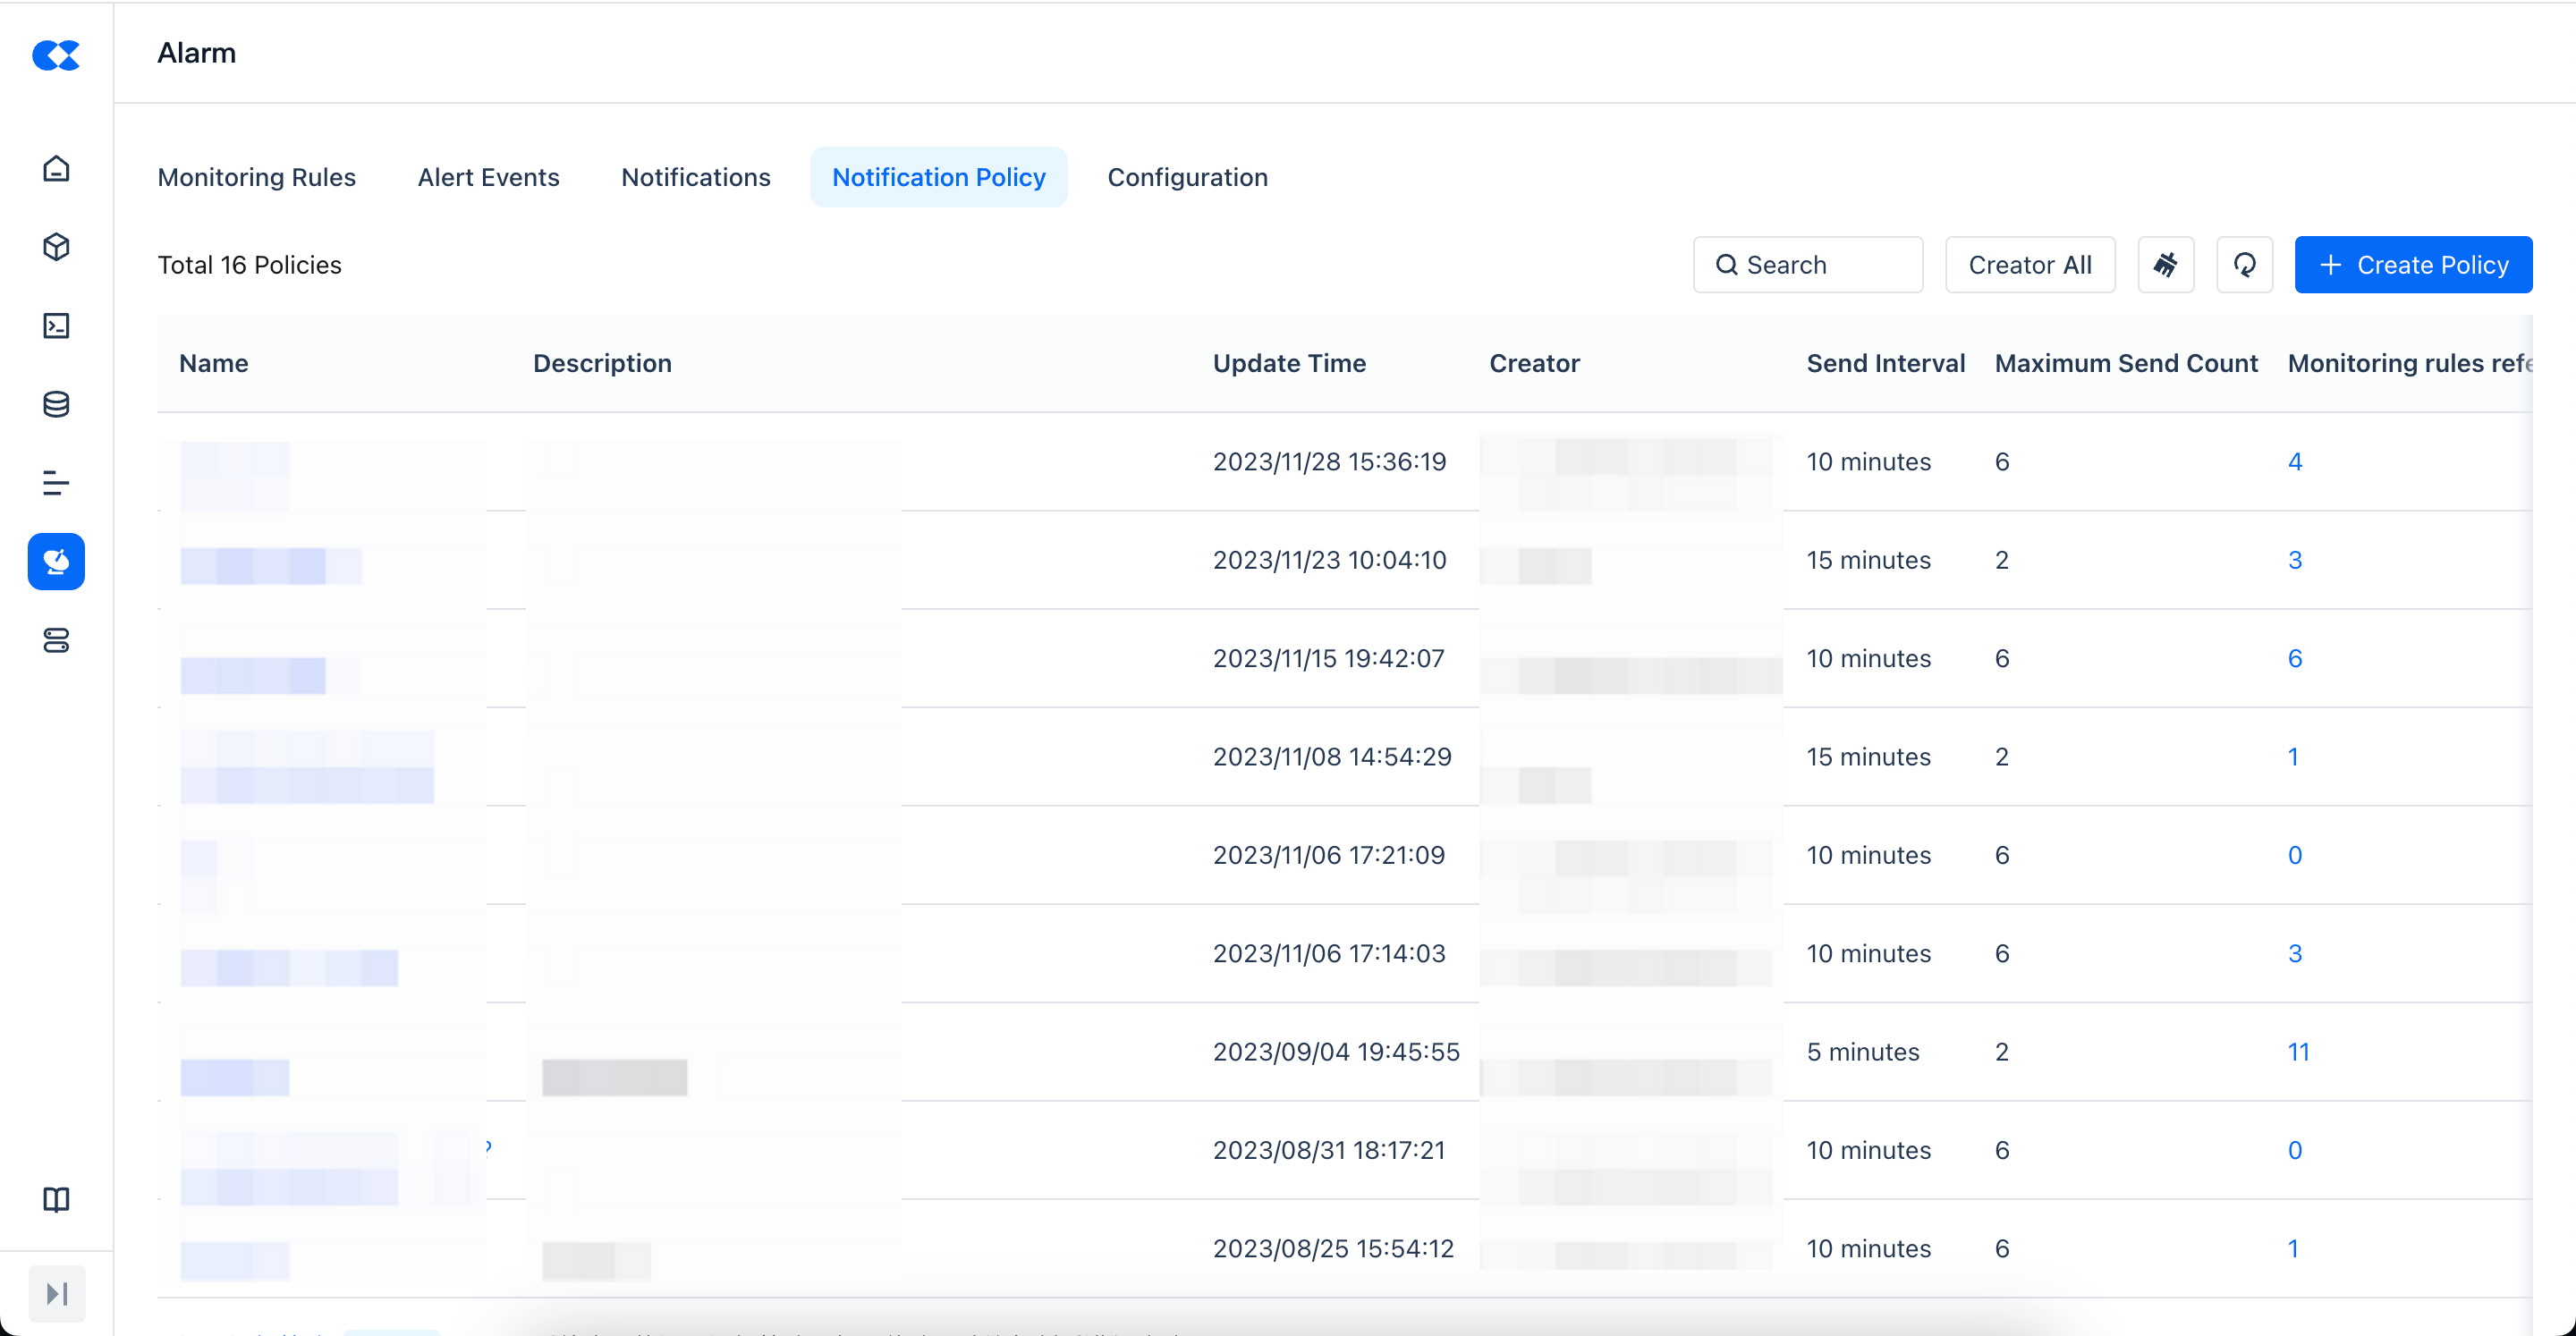
Notification Strategy
The notification strategy list displays all the definitions for the notification strategy, and you can perform search and filter operations in the list.
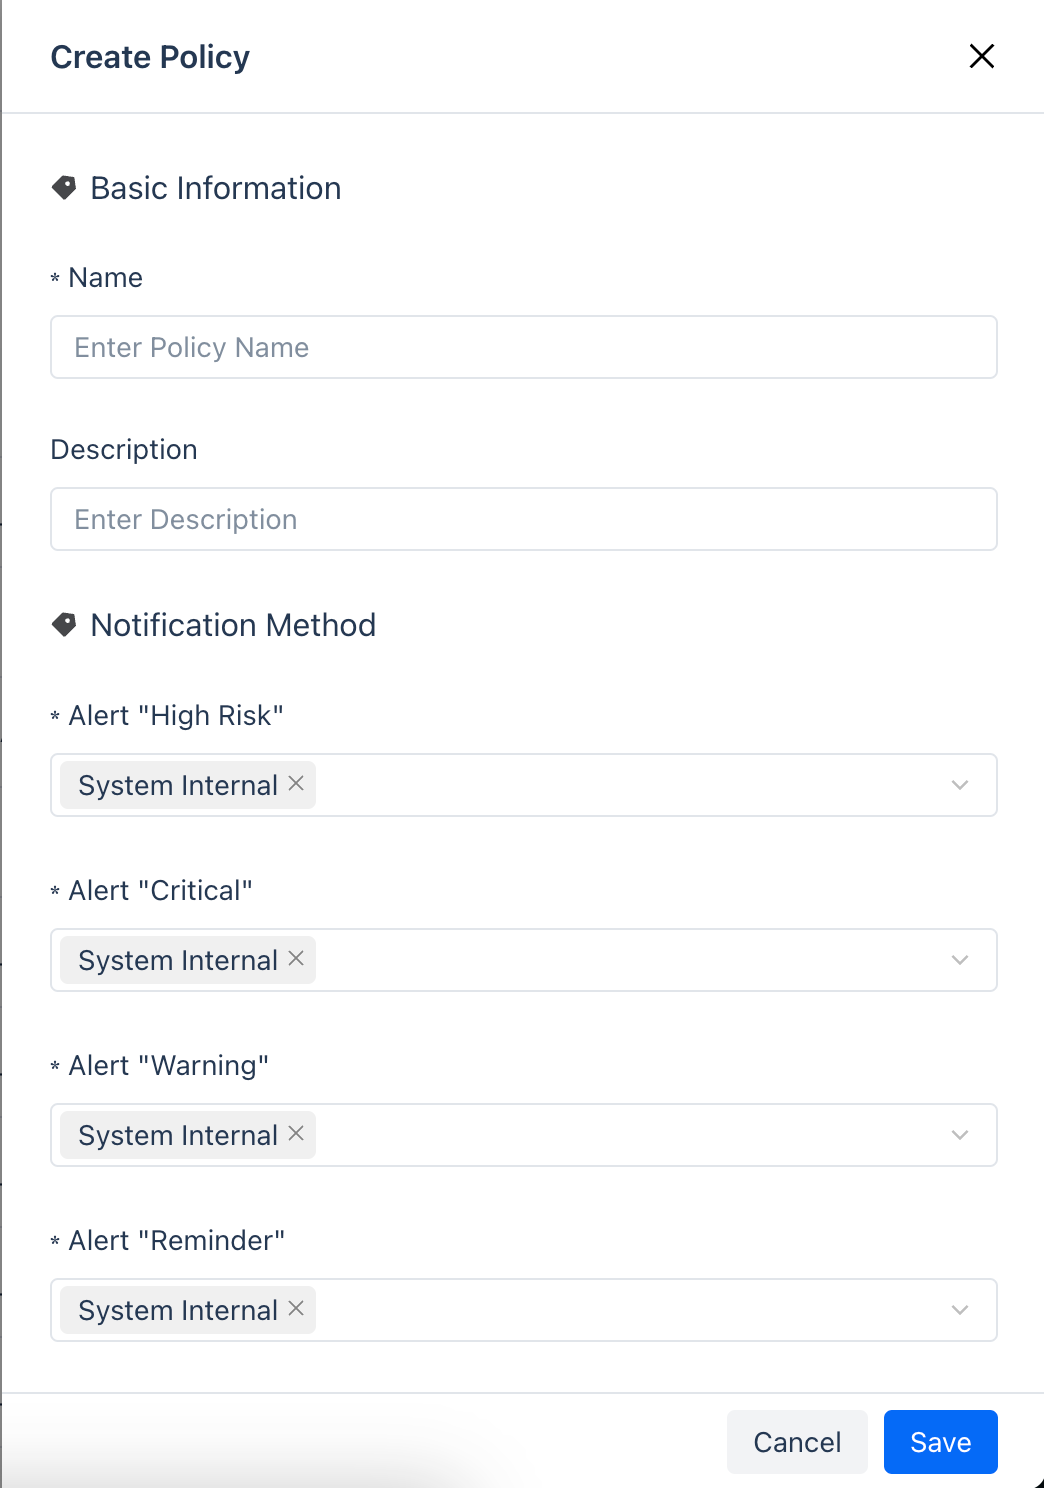
New Notification Strategy
Click the "New Strategy" button to create a new notification strategy as needed.
| Category | Parameter | Description |
|---|---|---|
| Basic Information | Name | The name of the notification strategy |
| Description | Not required, you can add a description of the current rule | |
| Notification Method | High Risk Alert | Set the specific method of notification for different alert levels, the supported methods are: wehook SMS Phone |
| Serious Alert | ||
| Warning Alert | ||
| Reminder Alert | ||
| Notification Time | Send Interval (Minutes) | The time interval between two alerts. |
| Maximum Send Times | The maximum number of alerts, after exceeding the set number, no more alerts will be generated. | |
| Do Not Disturb Start Time | After setting the do not disturb time, the system will not send alerts during this time period. For example, when the task status is set to trigger an alert when it fails, and the do not disturb time for this task is set to 00:00 to 08:00, no alert information will be sent during this time period. If it reaches 8 o'clock and the task is still in the above abnormal state, an alert will be sent. | |
| Do Not Disturb End Time |
Configuration Management
In configuration management, you can configure personal information and Webhooks.
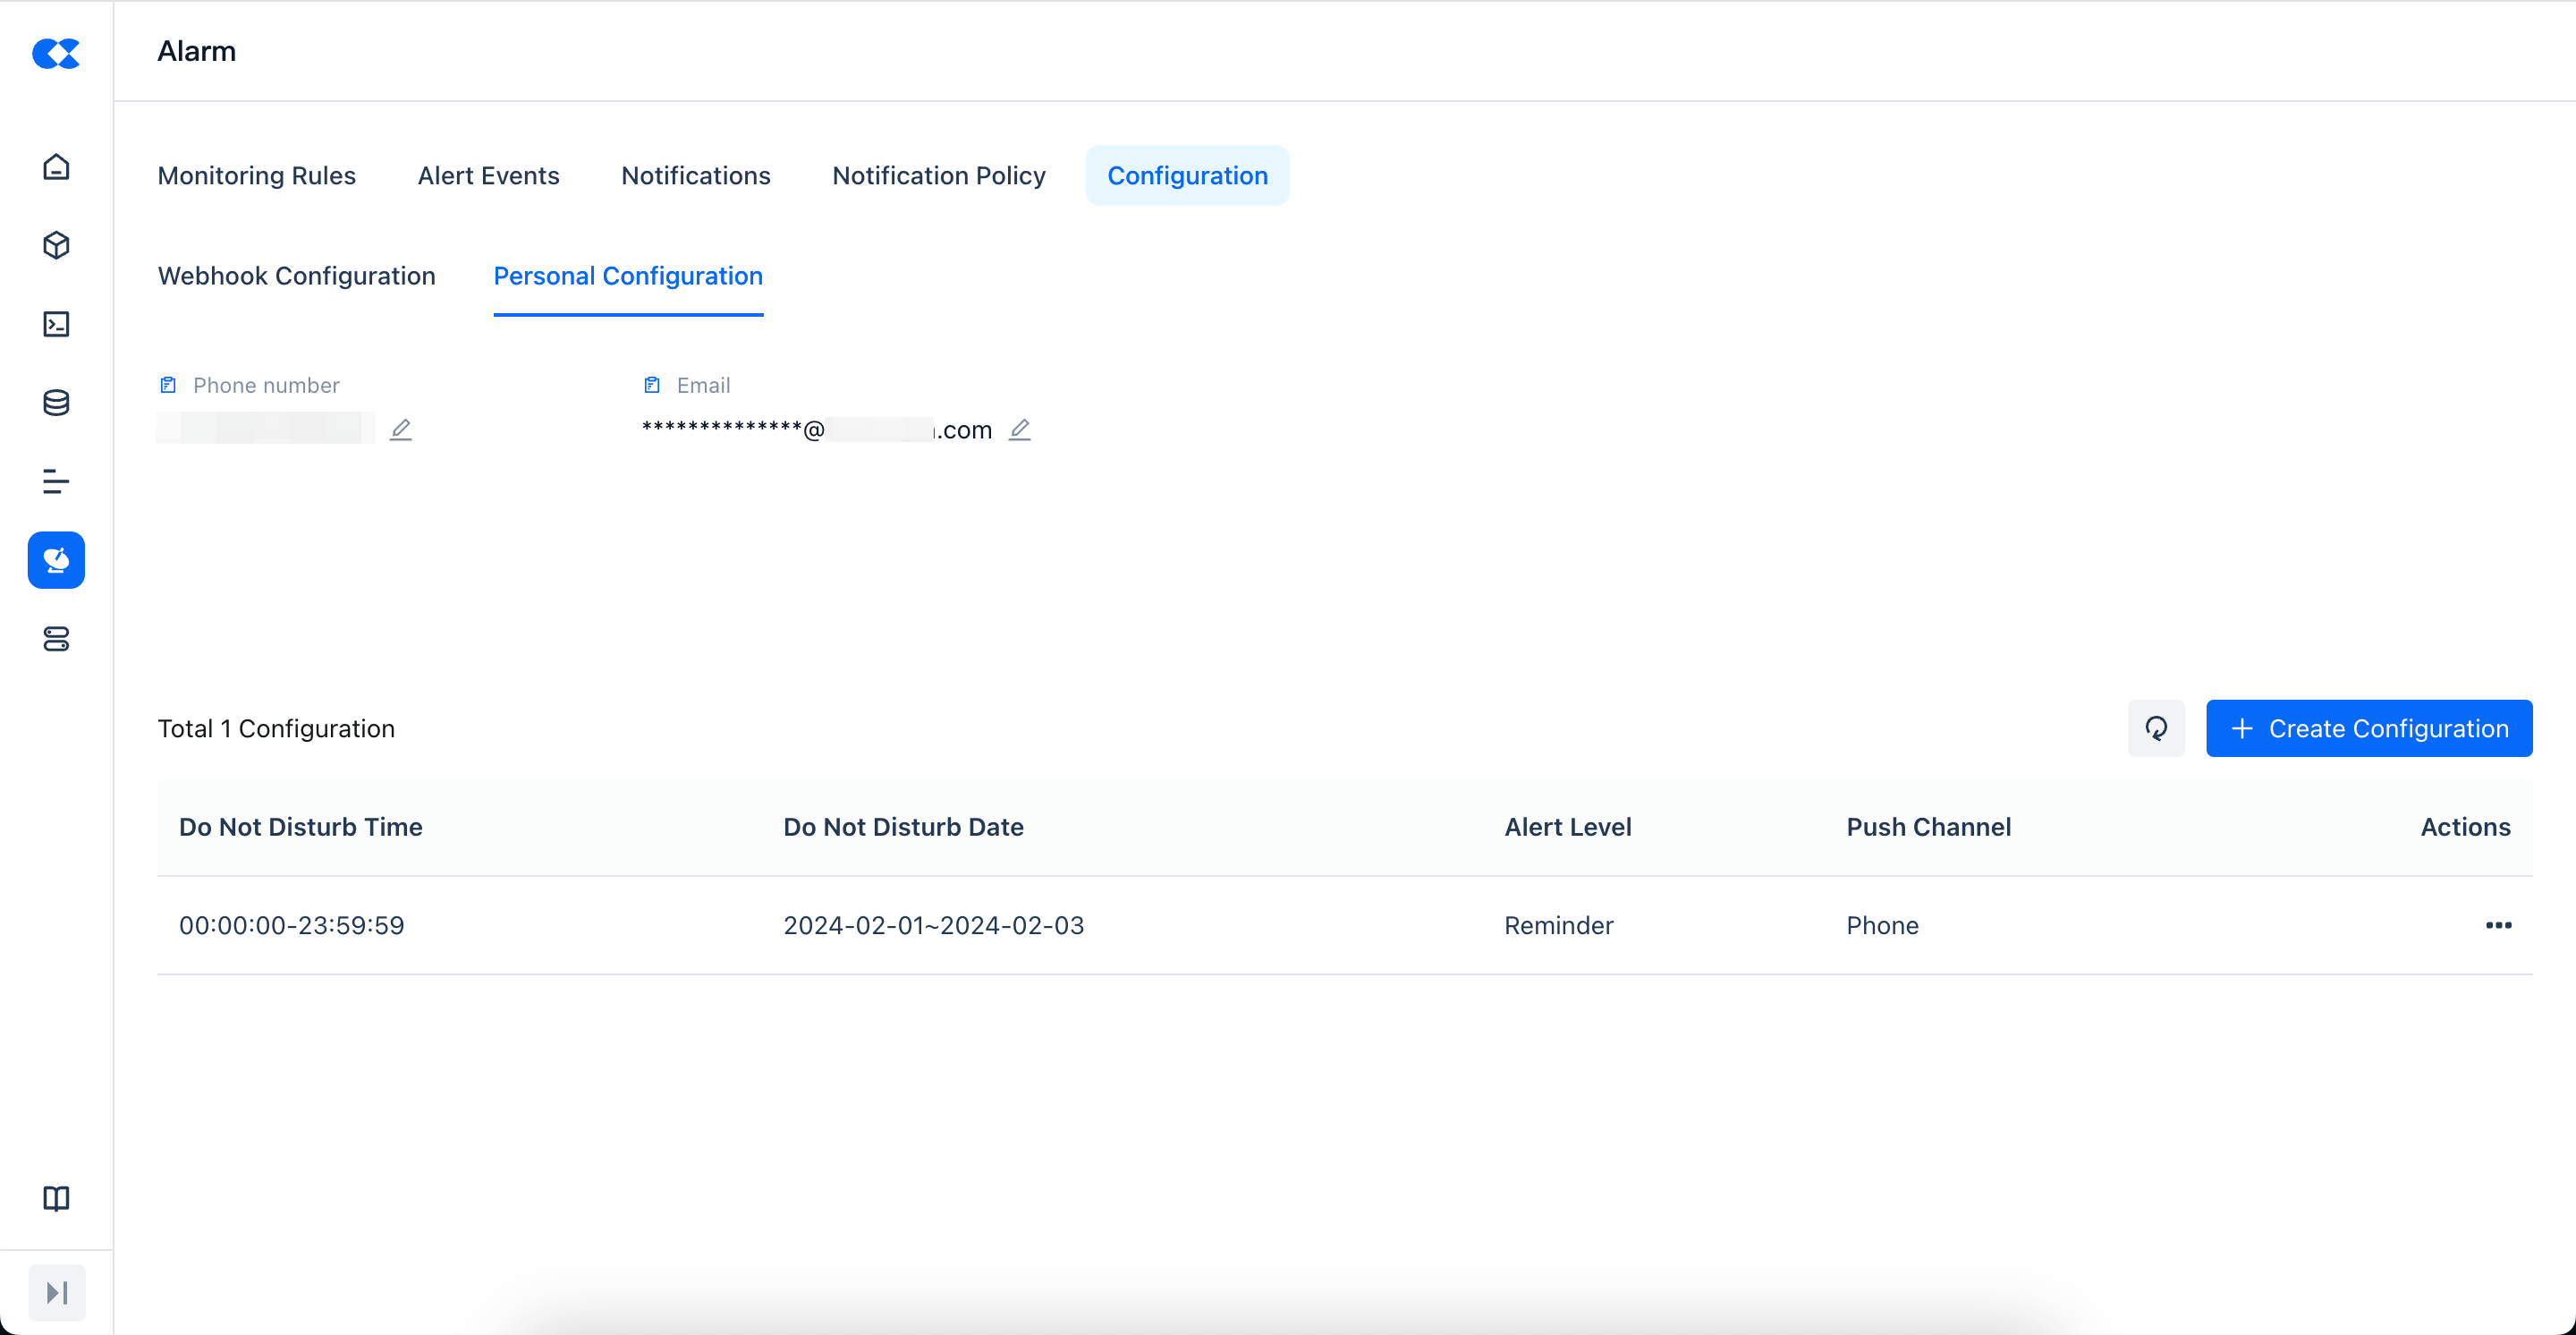
Personal Configuration
In personal configuration, you can modify the currently logged-in user, the phone number and email address used to receive alerts. In addition, it also supports setting a do-not-disturb period, during which you will not receive system alert messages.
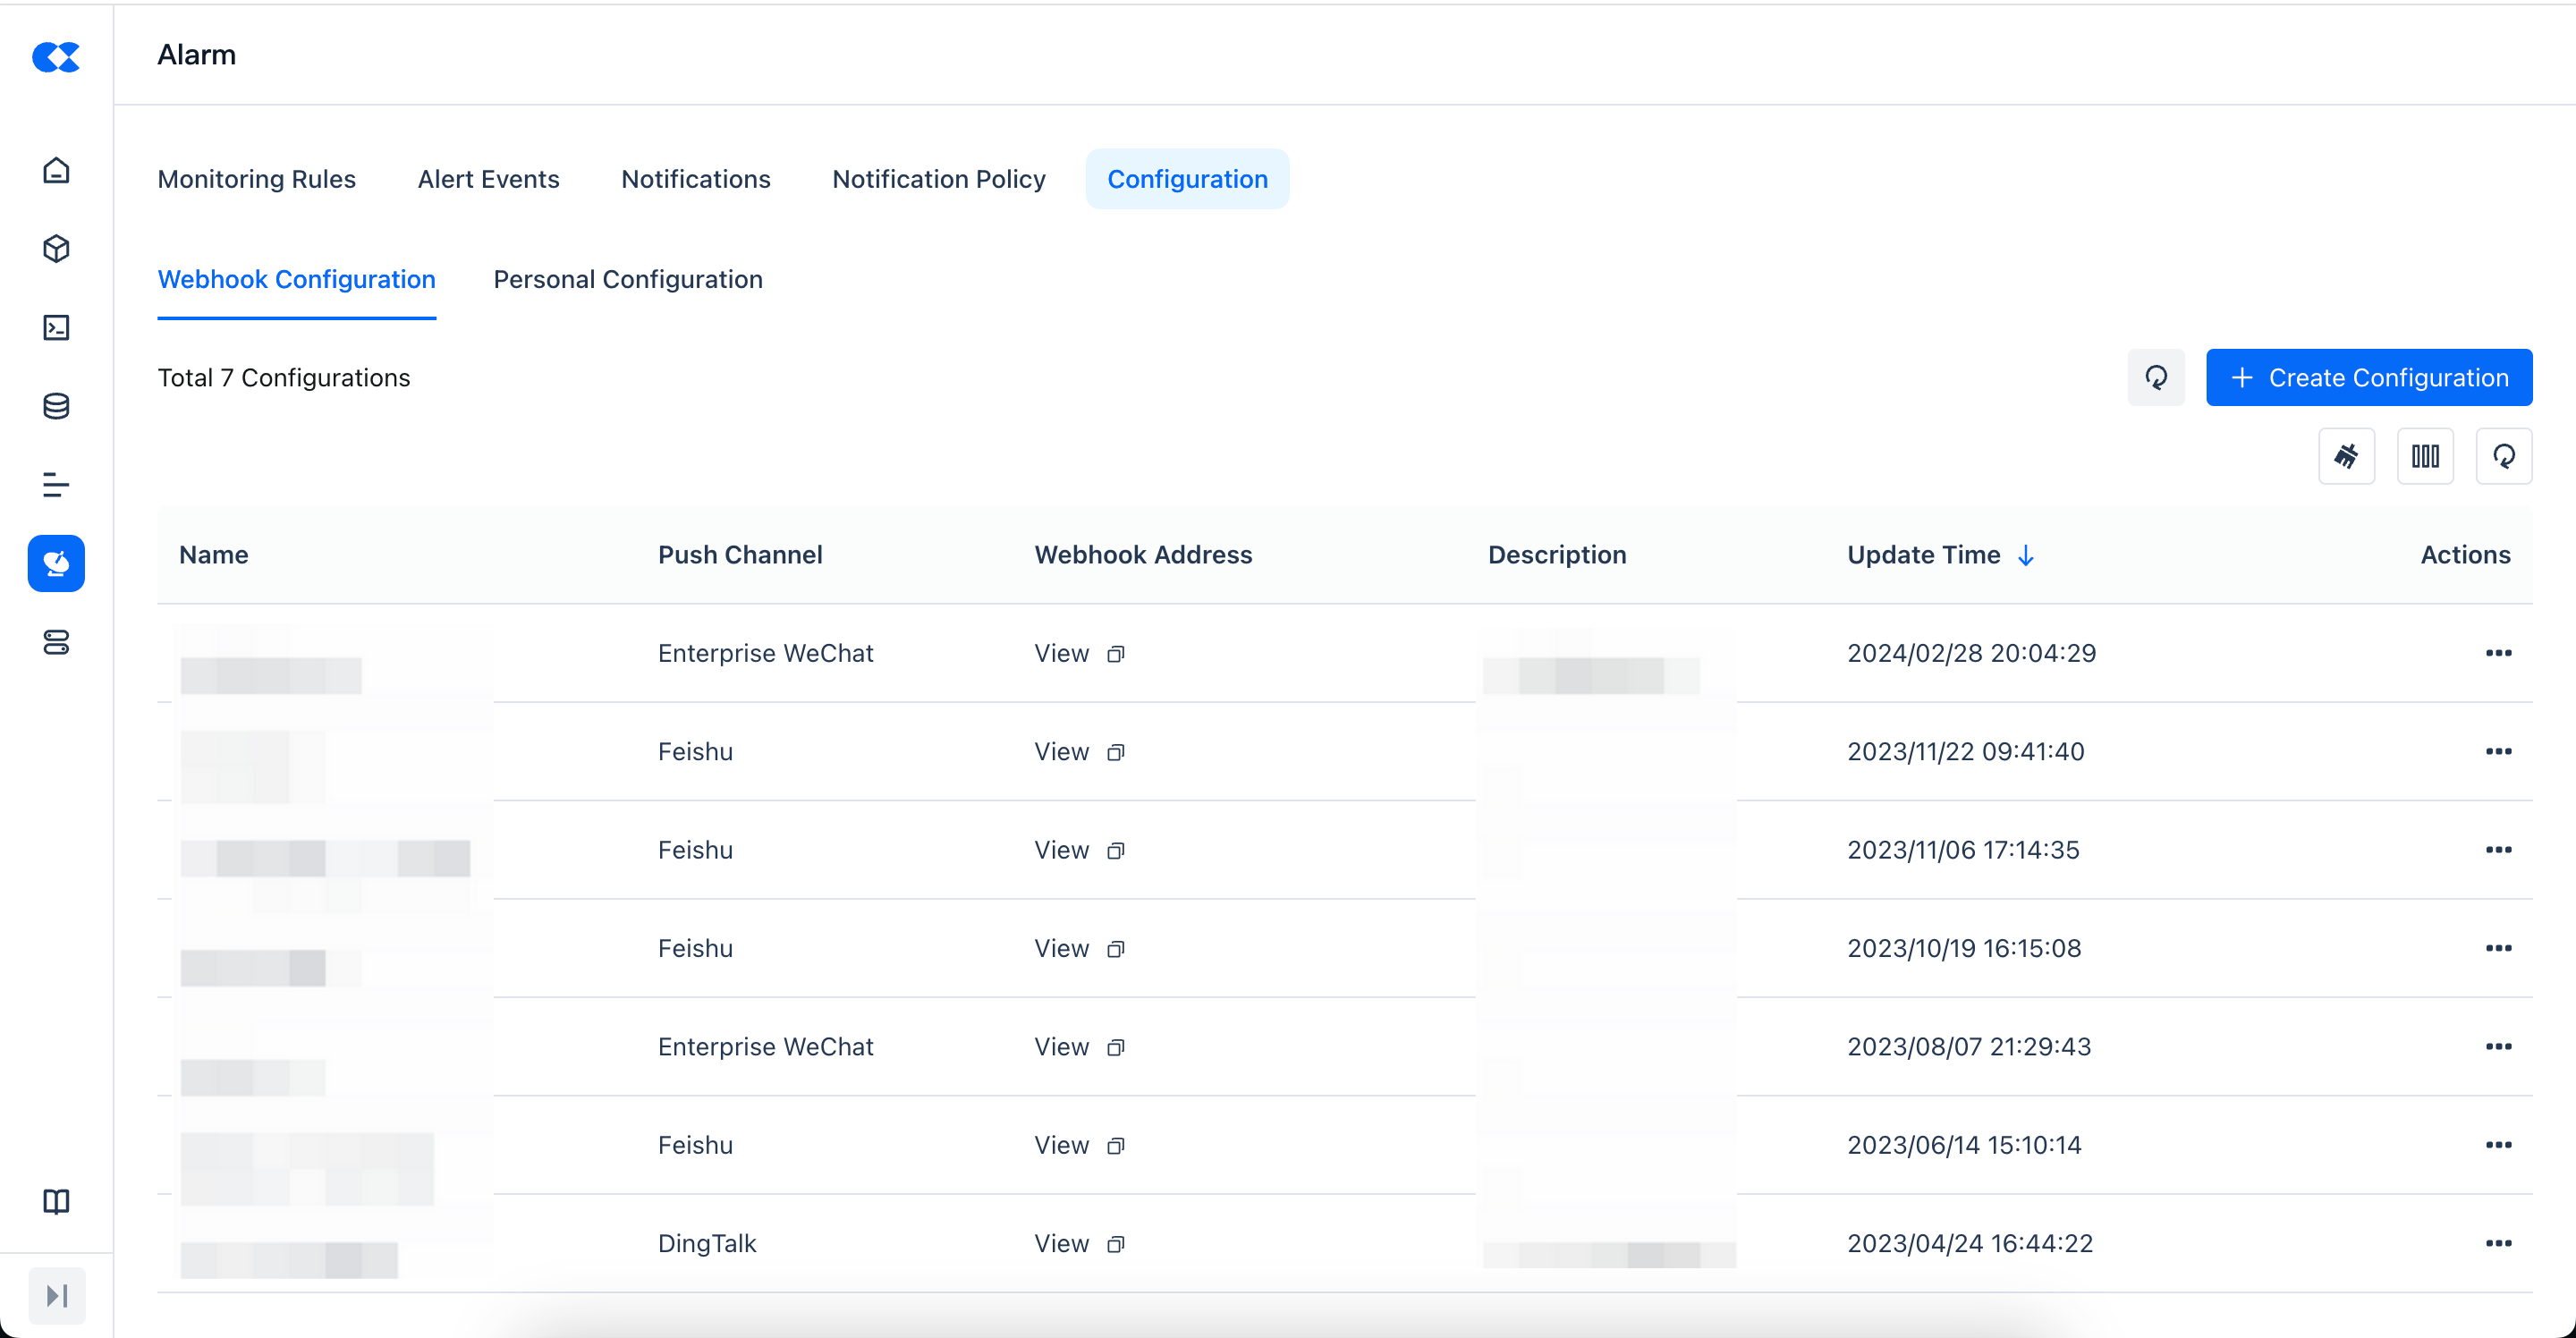
Webhook Configuration
Webhook configuration is used to define the Webhook channels needed for alert push, currently mainly supporting Feishu and DingTalk.
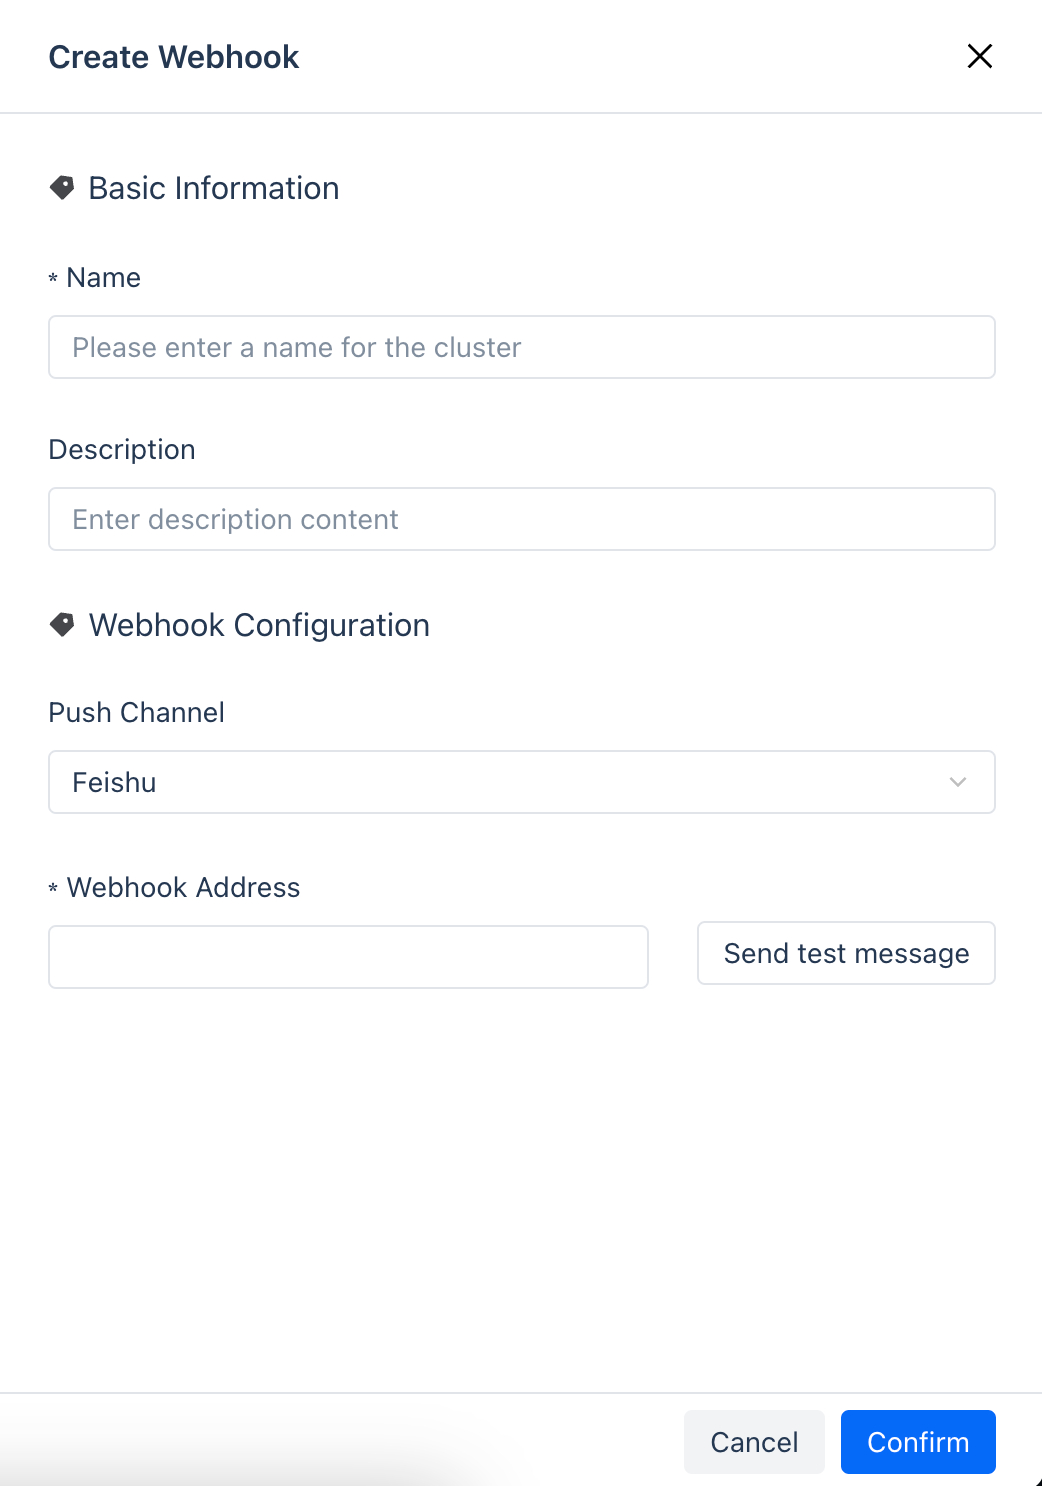
Creating a new webhook configuration
Click "Create Configuration", then fill in the required parameters on the page to create a new Webhook configuration. It is recommended to test after the Webhook address, and ensure that the test passes before clicking "Confirm" to save.
Others
Automatic closure of monitoring alerts
For monitoring alerts of task instance running failures, after the operation center handles the instance and recovers successfully, such as manually setting success or rerunning the instance successfully, the corresponding alert event will be automatically set to close, and there is no need for manual closure.
Webhook Alert Security Configuration
For IM platforms such as DingTalk, configuring Security Settings for webhook alert delivery requires adding "Singdata" as a mandatory keyword in the allowlist settings.