Lakehouse Job History
Overview
The Lakehouse Job History page (Job Profile) provides you with an intuitive way to view detailed information about queries executed in your Lakehouse account over the past 7 days. You can view a history of jobs including tasks submitted via the JDBC interface, Studio ad-hoc queries, and Studio scheduled tasks. This guide will help you analyze jobs that have failed or run slowly and provide corresponding solutions.
Job History Search
- Supports searching by job ID of SQL jobs.
- Supports searching by status:
- setup: SQL initialization phase, including compilation and optimization.
- resuming_cluster: Waiting for the Virtual Cluster to start. If it takes a long time to start, please contact technical support.
- queued: Job is queued waiting for resources. If this takes a long time, check whether Virtual Cluster resources are fully occupied, or consider scaling up.
- running: SQL data processing time. You can click Diagnostics to view the time taken by each operator.
- finish: Job has ended. Some jobs may perform a cleanup process at this stage, which takes additional time.
- Supports filtering by duration.
- Supports filtering by time. Currently up to 10,000 jobs from the past seven days can be queried.
- Supports filtering by the name of the cluster where the job ran.
- Supports filtering by the job submitter.
- Supports filtering by queryTag.
When submitting SQL, users can use the command
set query_tag=””to tag the job's source, and then filter by this tag in the interface.- Set query_tag in the Studio interface, select two SQL statements and execute them simultaneously:
- Add
query_tagin the JDBC URL so that each submitted SQL carries thequery_tagto identify its source, which can be filtered on the page.
- Set query_tag in Python code:
- The default Schema of a job (the context in which the submitted SQL runs) can be obtained via
select current_schema().
Analyzing Failed Jobs
When a job fails, you can view the reason for the failure through the job's Job Profile details. Here are some common failure reasons and solutions:
SQL Syntax Error
Error Example:
Error Code CZLH-42000 indicates an error related to SQL language parsing. [1,15] indicates the error occurred on line 1, column 15 of the SQL. In this example, the reason is that the ttt table does not exist. Note that if you submit tasks through the Studio development interface, the job editor includes descriptive header information that is not submitted to the SQL engine. Therefore, the correct line number should subtract the preceding header lines. You can view the correct positional relationship through the job content in the job details, or find the error location in the SQL editor.
Analyzing Slow Running Jobs
Slow running jobs may encounter issues during the compilation phase, the Virtual Cluster startup phase, or the execution phase. The following provides analysis and solutions for each phase:
Compilation Phase
Symptom: Job status shows “Initializing”.
Possible causes and solutions:
- Complex execution plan: The job may require a long time to optimize. Please be patient; it should not take more than 10 minutes under normal circumstances.
- Compilation resources fully occupied: If you submit a large number of SQL statements at once, compilation resources may be insufficient. Please reduce the frequency of SQL submissions. If you have high-concurrency query requirements, please submit a ticket for assistance.
Virtual Cluster Startup Phase
Symptom: Job status shows “Cluster Starting”. (The Virtual Cluster is currently being started.)
Waiting for Execution Phase
Symptom: Job status shows “Waiting for Execution”.
Possible causes and solutions:
- Insufficient computing resources in the current cluster: You can filter and view currently running jobs through the interface. A large number of simultaneously running jobs may be causing resource contention. Consider scaling up resources, or terminating large running jobs to free up resources.
Execution Phase
Symptom: Job status shows “Running”. At this stage, you can click in to view the execution status of each operator.
Possible causes and solutions:
- Waiting for resources: The job may be waiting for resource allocation. Check resource usage and submit a ticket if needed.
- Slow data reading: The job may be executing slowly due to slow data reads. Check the data storage and read strategy, and optimize the storage structure or adjust the read strategy if needed.
Sharing for Diagnosis
After entering the job details page, click the “Share” button to share the job with others. Recipients can view the content without logging in.  If you have questions or need further assistance, copy the link above and contact the Lakehouse team. We will diagnose and resolve the issue for you.
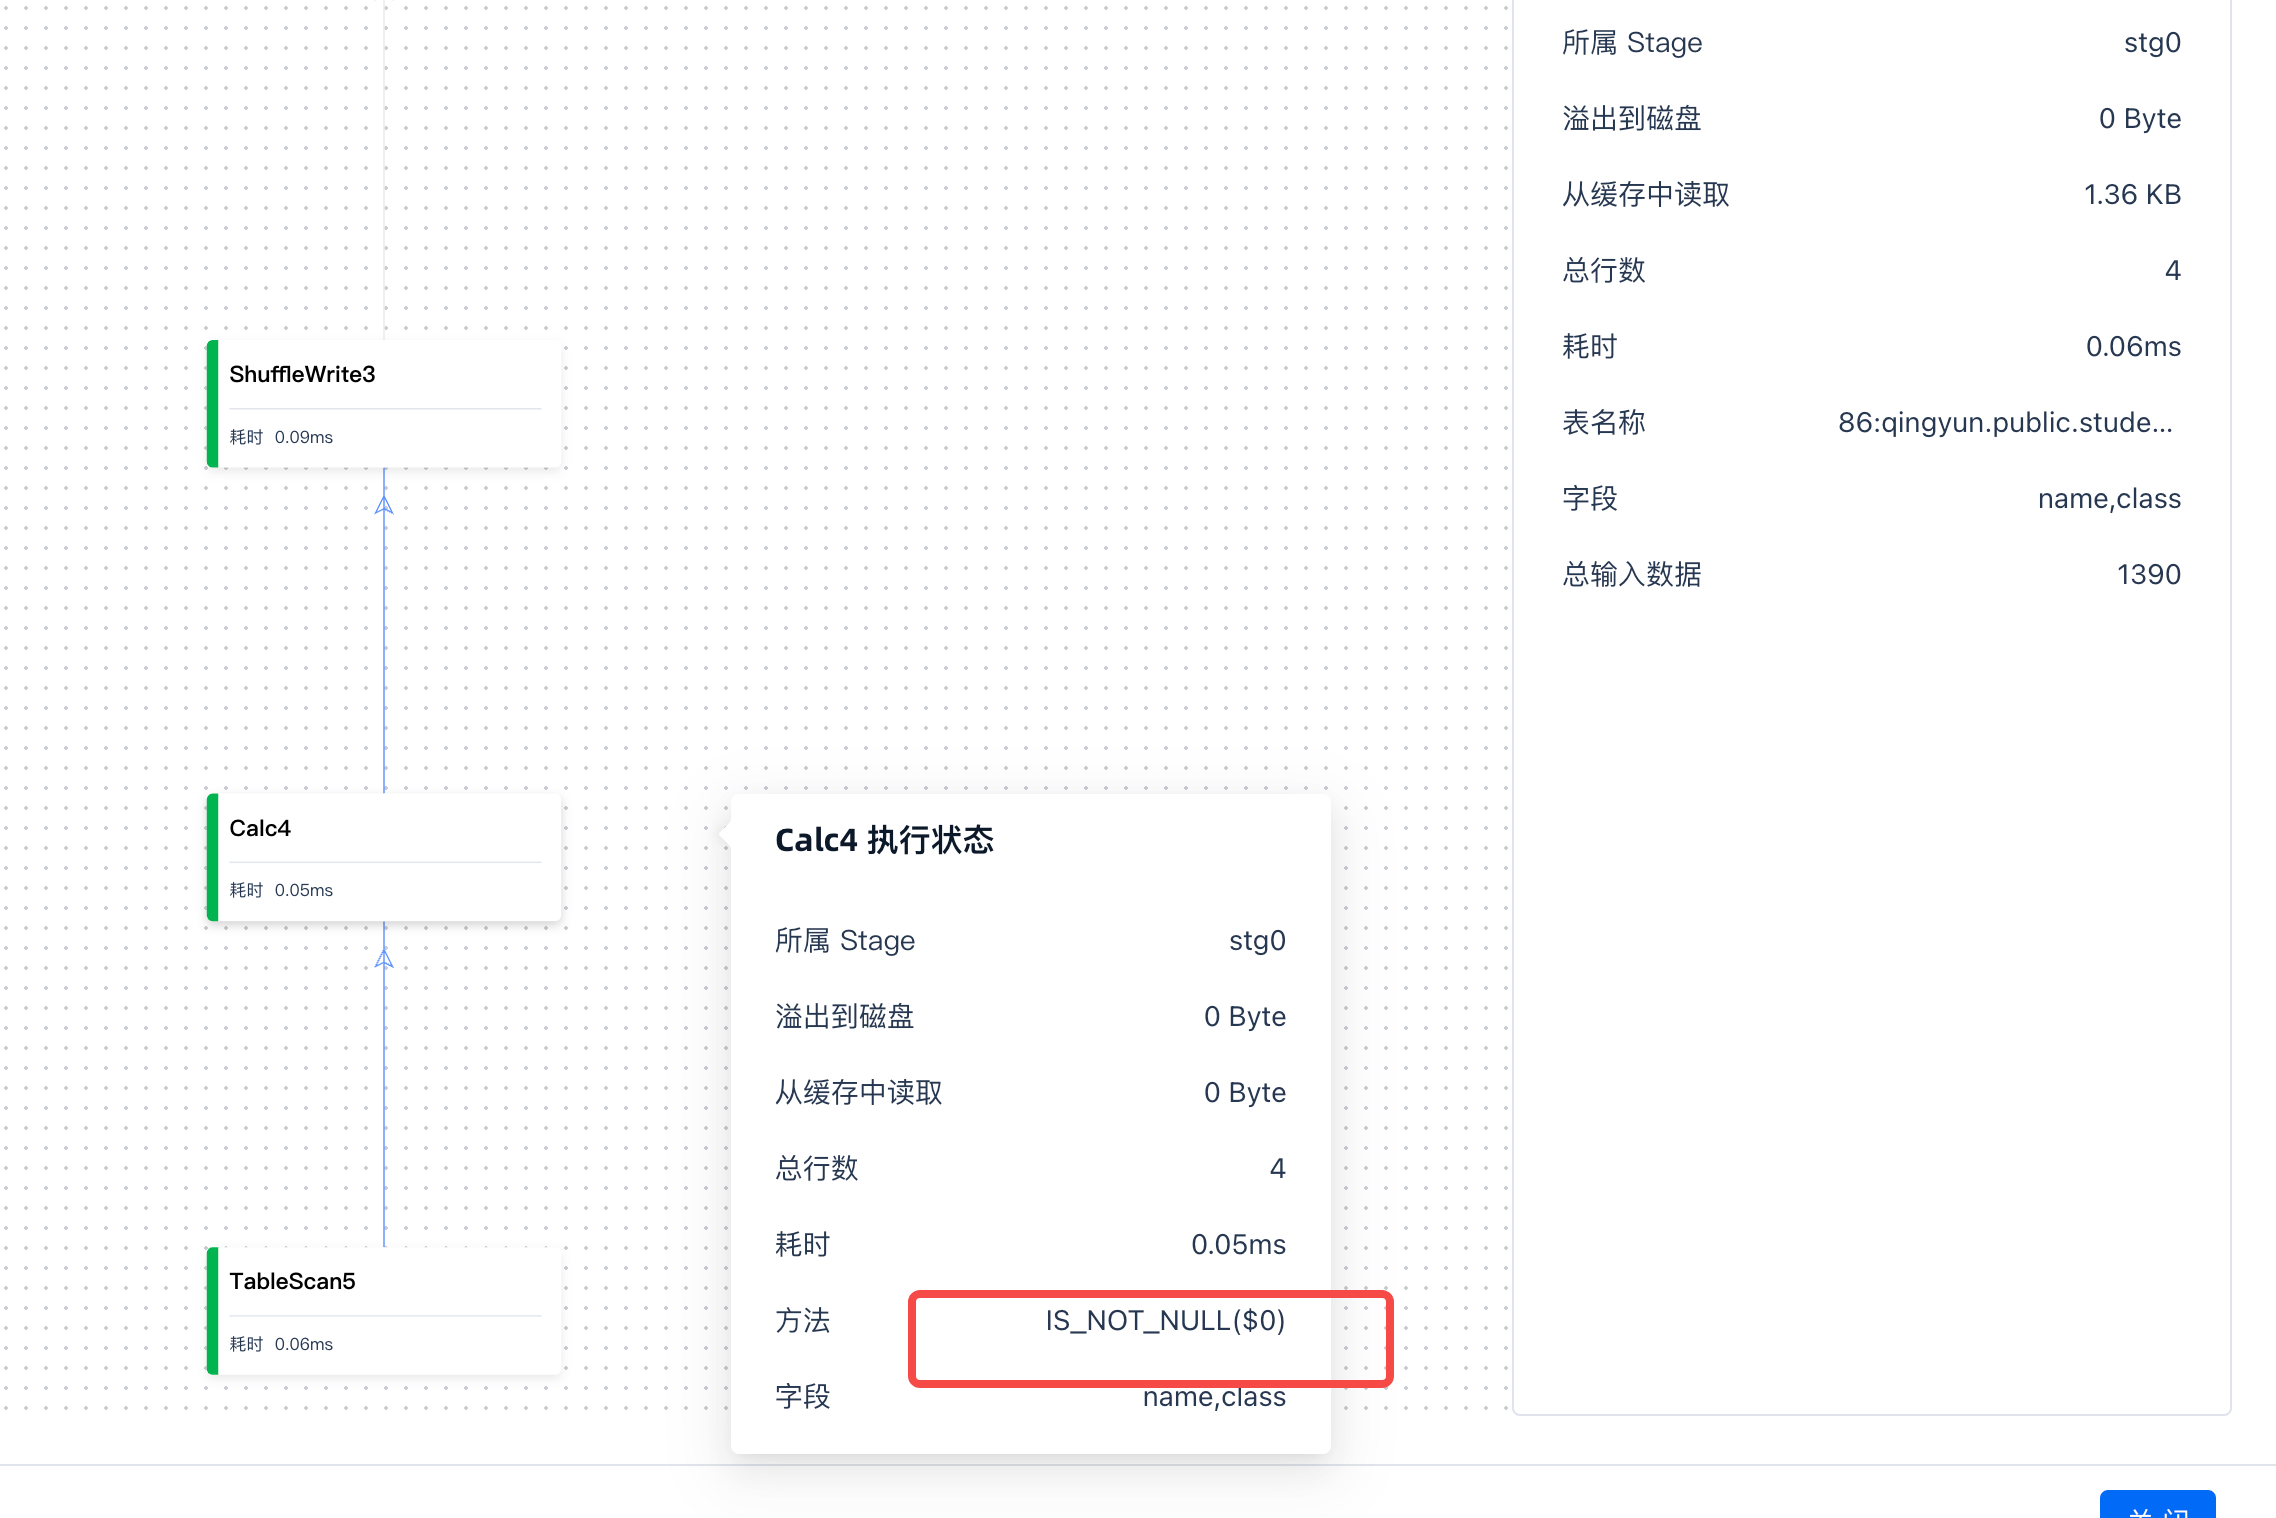
Viewing Execution Plan and Operator Details
During the execution phase, you can click on an executing operator to view the specific steps and strategy. For example, hovering the mouse over a specific operator highlights the corresponding operator in the SQL. This helps you identify which specific operator is causing the job to run slowly.