Using Virtual Clusters for Data Processing and Analysis
Tutorial Overview
Through this tutorial, you will learn how to use a Virtual Cluster to clean, transform, and aggregate the raw data of the New York Taxi public dataset Fhvhv trips, and perform multi-concurrent queries on the result data.
The tutorial example is shown in the figure below:
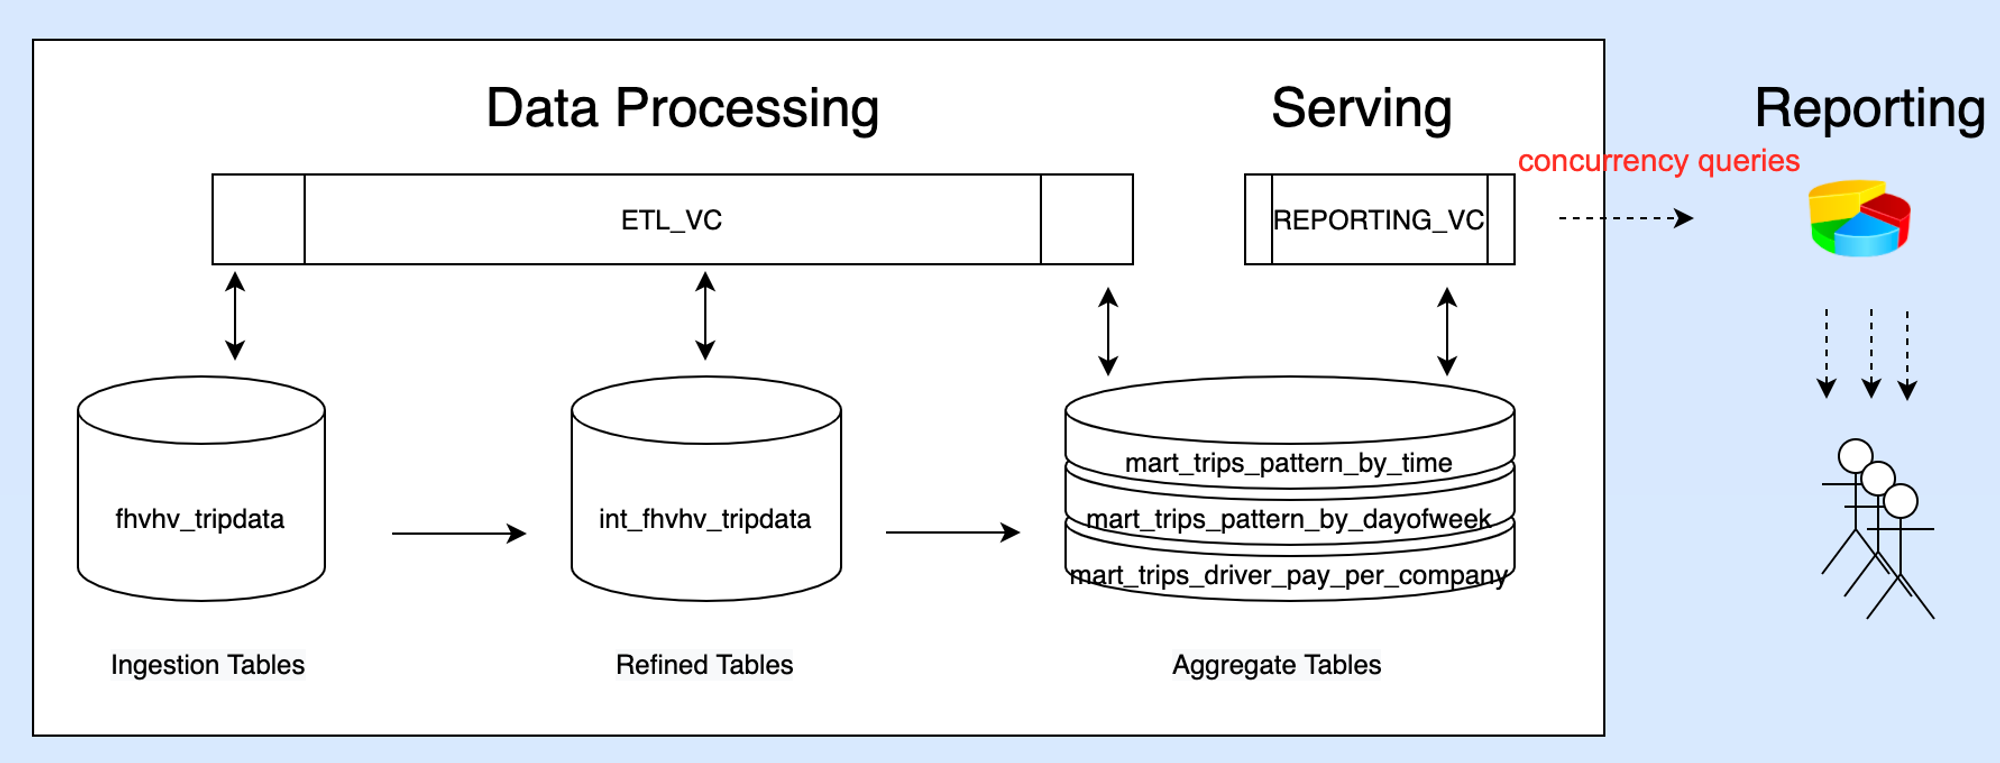
The tutorial content will be completed through the following steps:
- Environment Preparation: Check the raw data through the sample dataset, create a computing cluster and target Schema
- Data Transformation: Clean and aggregate data using a general-purpose cluster for subsequent analysis
- Ad-hoc Analysis: Perform single concurrent SQL query analysis using the Studio Web environment
- Concurrent Analysis: Simulate continuous multi-concurrency from the Dashboard through Python tasks
Getting Started
What is a Virtual Cluster?
A Virtual Cluster (VC or Cluster) is a computing resource object provided by Singdata Lakehouse for data processing and analysis. Virtual Clusters provide the necessary resources such as CPU, memory, and local temporary storage (SSD medium) to execute SQL jobs in the Lakehouse. Clusters feature quick creation/destruction, scaling up/down, pausing/resuming, and are charged based on resource specifications and usage duration, with no costs incurred when paused or deleted.
Virtual Clusters offer two types of clusters, general-purpose and analytical, to meet the isolation and optimization needs of different workloads for ETL and analysis scenarios.
As shown in the figure below:
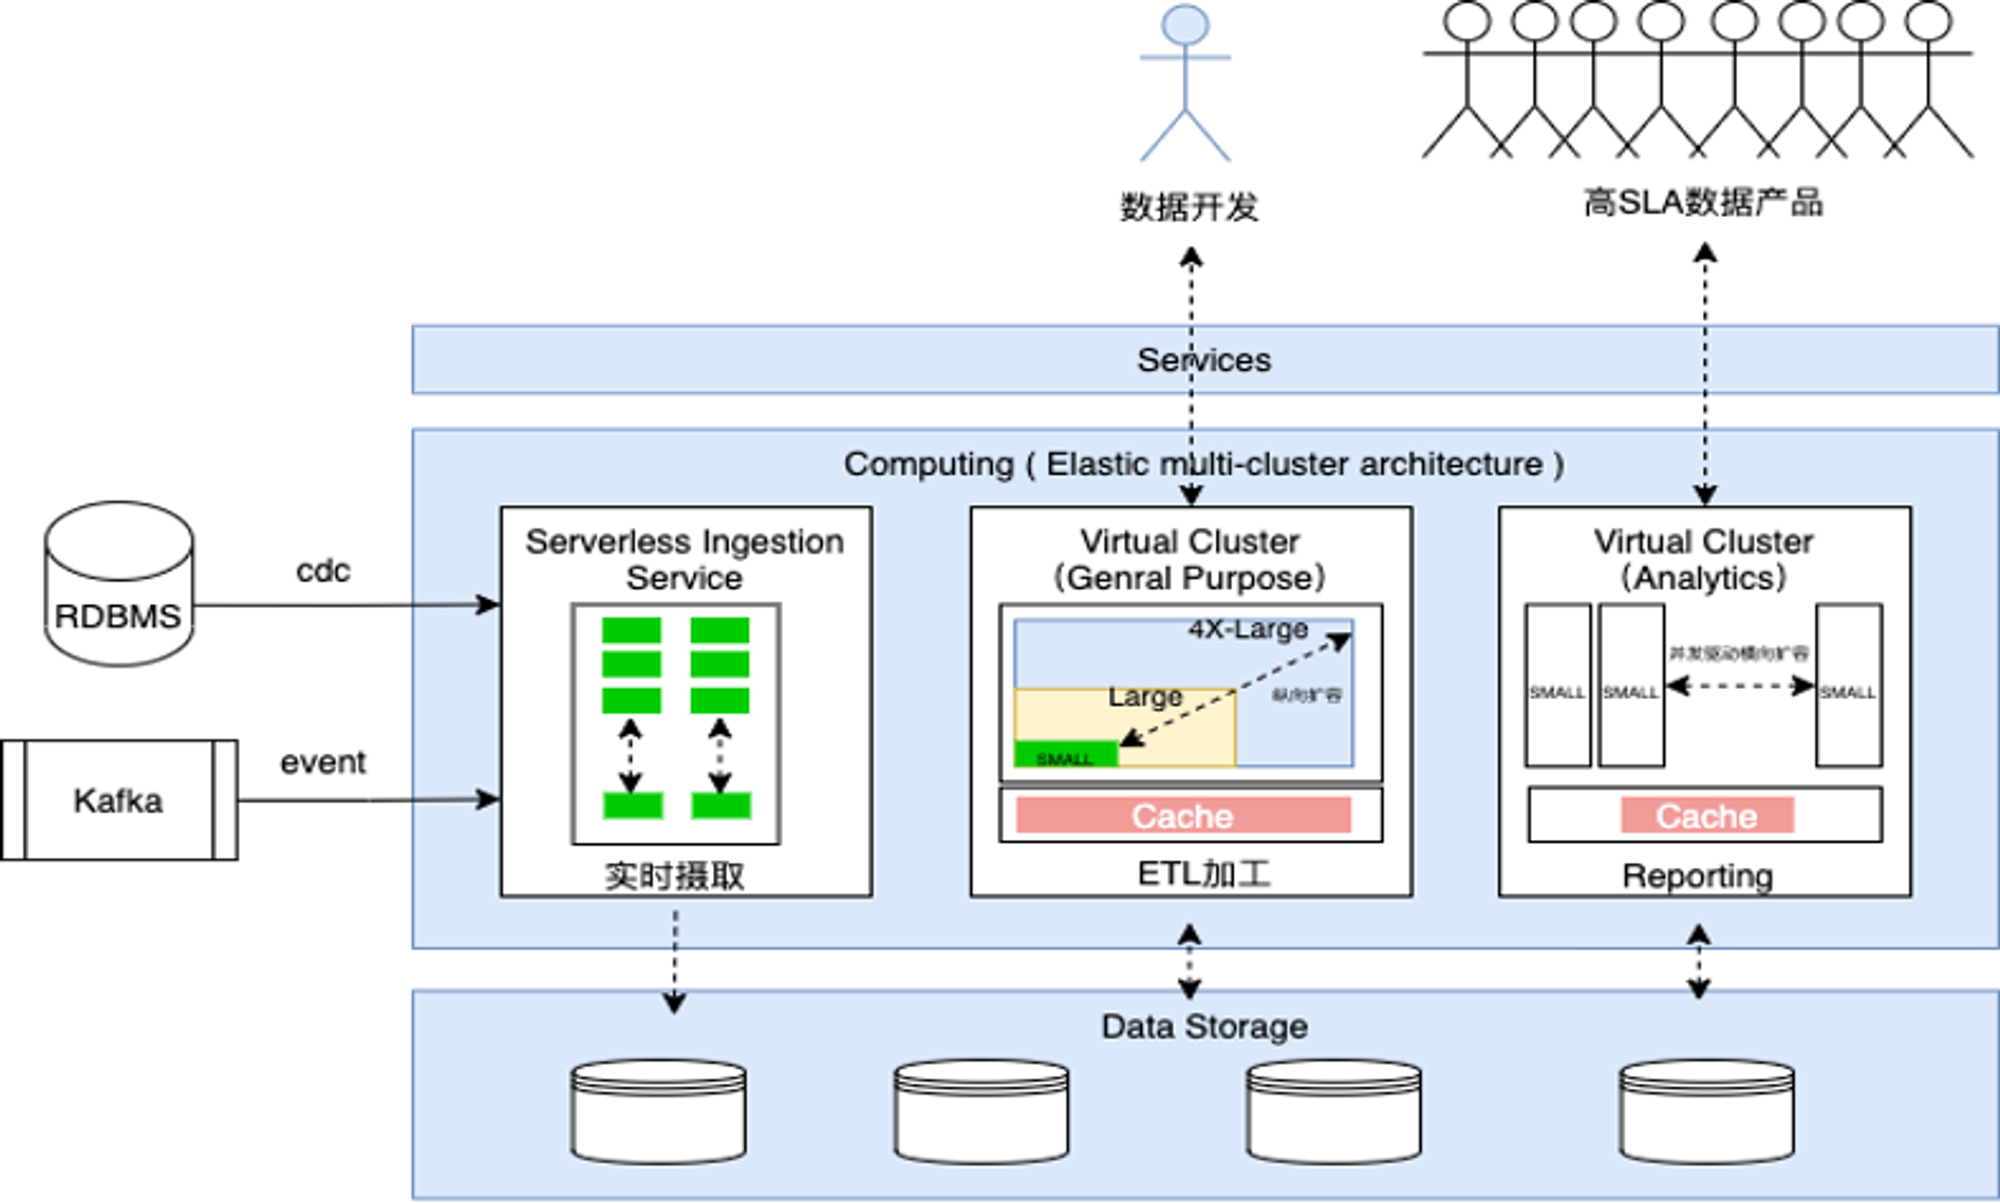
It is recommended to use general-purpose clusters for ETL data processing and analytical clusters for query analysis or supporting data product applications. General-purpose clusters support vertical scaling to meet the needs of different scales of ETL Pipeline tasks. Analytical clusters support horizontal scaling with multiple replicas within the cluster to meet the elastic capabilities for concurrent queries.
This tutorial will use general-purpose clusters for data cleaning and transformation, and analytical clusters for low-latency concurrent analysis.
Tutorial Goals
- Create and use Virtual Clusters for different business workloads
- Understand and use the elastic concurrency features of analytical clusters
Step01 Check Raw Data
- Create Virtual Clusters
Create both general-purpose (GENERAL PURPOSE) and analytical (ANALYTICS) clusters to achieve load isolation for ETL processing and query analysis.
-- 1.1 Create a virtual cluster for ETL processing
CREATE VCLUSTER ETL_VC
VCLUSTER_SIZE = MEDIUM
VCLUSTER_TYPE = GENERAL
AUTO_SUSPEND_IN_SECOND = 60
AUTO_RESUME = TRUE;

-- 1.2 Create a virtual cluster for BI analysis, set elastic concurrency to support multiple concurrent queries
CREATE VCLUSTER REPORTING_VC
VCLUSTER_SIZE = XSMALL
VCLUSTER_TYPE = ANALYTICS
MIN_REPLICAS = 1
MAX_REPLICAS = 4
MAX_CONCURRENCY = 8
AUTO_SUSPEND_IN_SECOND = 300
AUTO_RESUME = TRUE ;

-- 1.3 View cluster resources
show  vclusters ;

-- 1.4 Switch the virtual cluster used in the current session,It will only take effect if selected and executed together with the SQL to be executed.It will only take effect if selected and executed together with the SQL to be executed.
USE VCLUSTER REPORTING_VC;

- View the original dataset in the public dataset
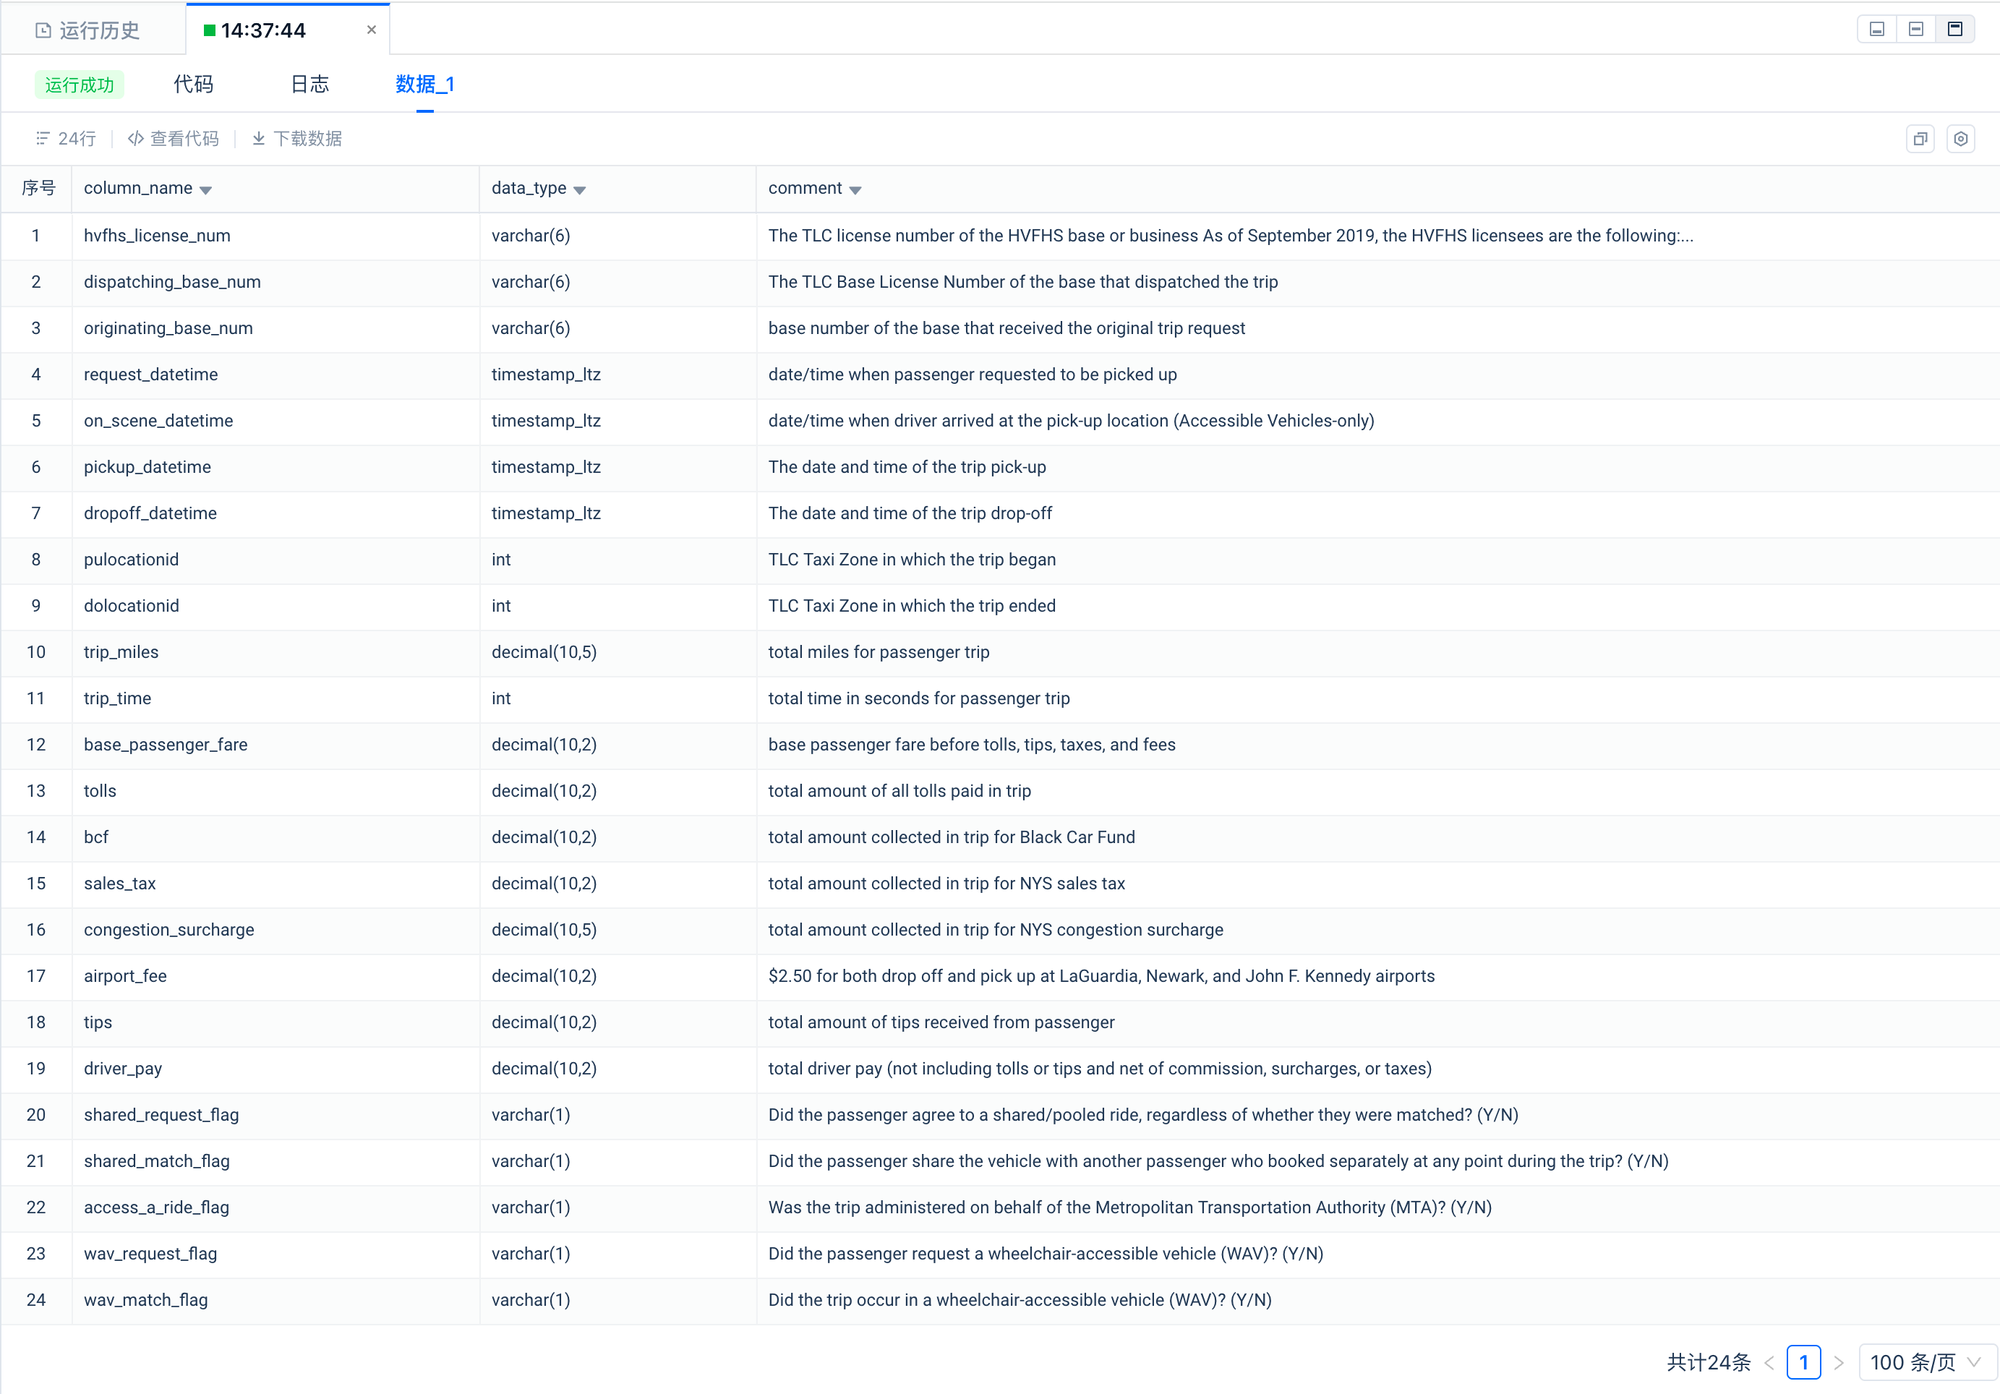
2.1 View the field information of the original dataset.
--Describes New York City For-Hire-Vehicle trips.
desc clickzetta_sample_data.nyc_taxi_tripdata.fhvhv_tripdata;
2.2 Preview Data Details
--Sample Of Trip Record Data
select * from clickzetta_sample_data.nyc_taxi_tripdata.fhvhv_tripdata limit 10;

2.3 View the Number of Records in the Dataset
--1.49 billion rows
select count(*) from clickzetta_sample_data.nyc_taxi_tripdata.fhvhv_tripdata;
- Specify the use of ETL_VC for data processing, and create the schema where the target table is located,It will only take effect if selected and executed together with the SQL to be executed.
use vcluster ETL_VC;
create schema tutorial;
use tutorial;
## 2. Clean and transform the original dataset using CTAS and write to a new table
--2. Clean and transform the original dataset
CREATE table tutorial.int_fhvhv_tripdata
as
SELECT
  hvfhs_license_num,
  CASE
    WHEN hvfhs_license_num = 'HV0002' THEN 'juno'
    WHEN hvfhs_license_num = 'HV0003' THEN 'uber'
    WHEN hvfhs_license_num = 'HV0004' THEN 'via'
    WHEN hvfhs_license_num = 'HV0005' THEN 'lyft'
    ELSE null
  END AS company,
  ltrim(rtrim(upper(dispatching_base_num))) dispatching_base_num,
  ltrim(rtrim(upper(originating_base_num))) originating_base_num,
  request_datetime,
  on_scene_datetime,
  pickup_datetime,
  dropoff_datetime,
  PULocationID,
  DOLocationID,
  trip_miles,
  trip_time,
  base_passenger_fare,
  tolls,
  bcf,
  sales_tax,
  congestion_surcharge,
  airport_fee,
  tips,
  driver_pay,
  CASE
    WHEN shared_request_flag = 'Y' THEN true
    WHEN shared_request_flag IN ('N', ' ') THEN false
    ELSE null
  END AS shared_request_flag,
  CASE
    WHEN shared_match_flag = 'Y' THEN true
    WHEN shared_match_flag IN ('N', ' ') THEN false
    ELSE null
  END AS shared_match_flag,
  CASE
    WHEN access_a_ride_flag = 'Y' THEN true
    WHEN access_a_ride_flag IN ('N', ' ') THEN false
    ELSE null
  END AS access_a_ride_flag,
  CASE
    WHEN wav_request_flag = 'Y' THEN true
    WHEN wav_request_flag IN ('N', ' ') THEN false
    ELSE null
  END AS wav_request_flag,
  CASE
    WHEN wav_match_flag = 'Y' THEN true
    WHEN wav_match_flag IN ('N', ' ') THEN false
    ELSE null
  END AS wav_match_flag
FROM clickzetta_sample_data.nyc_taxi_tripdata.fhvhv_tripdata;
Validate Processed Data
SELECT * FROM tutorial.int_fhvhv_tripdata LIMIT 10;

- Aggregate the cleaned data according to the analysis topics to generate data tables for analysis
--Scenario 1: Analyze taxi trip patterns by time of day
CREATE table tutorial.mart_trips_pattern_by_time
AS
SELECT
  EXTRACT(HOUR FROM pickup_datetime) AS hour,
  COUNT(*) AS trip_count
FROM tutorial.int_fhvhv_tripdata
GROUP BY hour;

--Scenario 2: Analyze taxi trip patterns by day of the week
CREATE table tutorial.mart_trips_pattern_by_dayofweek
AS
SELECT
  EXTRACT(DAY FROM pickup_datetime) AS day_of_week,
  COUNT(*) AS trip_count
FROM tutorial.int_fhvhv_tripdata
GROUP BY day_of_week;

--Scenario 3: Analyze taxi trip patterns by pickup location
CREATE table tutorial.mart_trips_pattern_by_pickup_location
AS
SELECT
  PULocationID,
  COUNT(*) AS trip_count
FROM tutorial.int_fhvhv_tripdata
GROUP BY PULocationID;

--Scenario 4: Analyze taxi trip patterns by dropoff location
CREATE table tutorial.mart_trips_pattern_by_dropoff_location
AS
SELECT
  DOLocationID,
  COUNT(*) AS trip_count
FROM tutorial.int_fhvhv_tripdata
GROUP BY DOLocationID;

--Scenario 5:Trips per day
CREATE table tutorial.mart_trips_per_day
AS
SELECT
  pickup_datetime::date AS date,
  sum(trip_miles) AS trip_miles
FROM tutorial.int_fhvhv_tripdata
GROUP BY date;

--Scenario 6:Total driver pay per company
CREATE table tutorial.mart_trips_driver_pay_per_company
AS
SELECT
  CONCAT(YEAR(pickup_datetime), '-', MONTH(pickup_datetime)) AS year_month,
  company,
  sum(driver_pay) AS driver_pay
FROM tutorial.int_fhvhv_tripdata
GROUP BY year_month,company;
Check if the data object was created successfully.
-- Check the status of the newly created data model
show tables in tutorial;

--Check the data of the newly created data model
SELECT * FROM tutorial.mart_trips_driver_pay_per_company
WHERE substr(year_month,0,4)='2021'
ORDER BY year_month ASC;

Step03 Use Analytical Cluster for Single Concurrency Query
- Switch the current Session's virtual cluster to REPORTING_VC
-- 1. Use analytical VC for accelerated query analysis,It will only take effect if selected and executed together with the SQL to be executed.
USE VCLUSTER REPORTING_VC;
-- Set query job tag for retrieval and filtering,It will only take effect if selected and executed together with the SQL to be executed.
SET QUERY_TAG = 'Tutorial02';
- Execute 6 Business Analysis Queries Sequentially
--Scenario 1: Analyze taxi trip patterns by time of day
SELECT * FROM tutorial.mart_trips_pattern_by_time
ORDER BY HOUR ASC;

--Scenario 2: Analyze taxi trip patterns by day of the week
SELECT * FROM tutorial.mart_trips_pattern_by_dayofweek
ORDER BY day_of_week ASC;

--Scenario 3: Analyze taxi trip patterns by pickup location
SELECT * FROM tutorial.mart_trips_pattern_by_pickup_location
ORDER BY trip_count DESC
LIMIT 10;

--Scenario 4: Analyze taxi trip patterns by dropoff location
SELECT * FROM tutorial.mart_trips_pattern_by_dropoff_location
ORDER BY trip_count DESC
LIMIT 10;

--Scenario 5:Trips per day
SELECT * FROM tutorial.mart_trips_per_day
WHERE CONCAT(YEAR(date) , MONTH(date)) = '202110'
ORDER BY date;

--Scenario 6:Total driver pay per company
SELECT * FROM tutorial.mart_trips_driver_pay_per_company
WHERE substr(year_month,0,4)='2021'
ORDER BY year_month ASC;
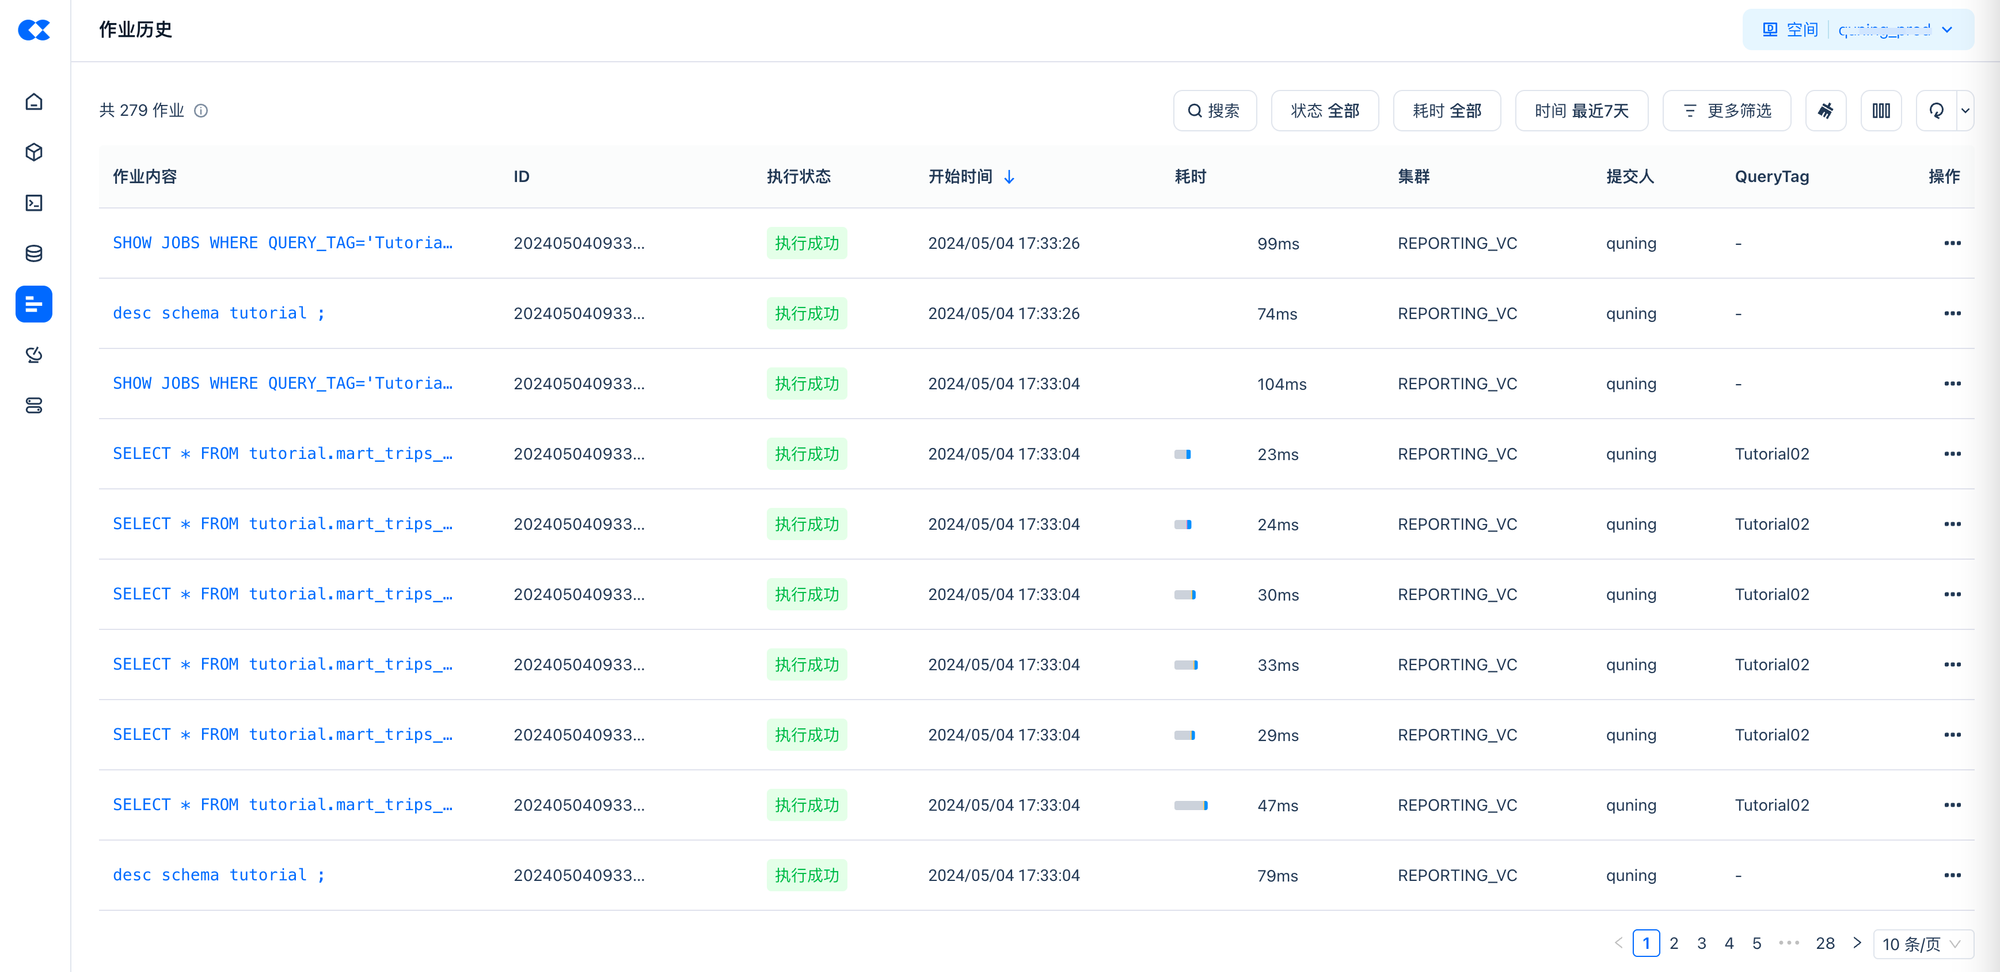
3. Observe the Latency Results of the Query
-- Clear QUERY_TAG
SET QUERY_TAG = '';
-- View the execution results of running jobs
SHOW JOBS WHERE QUERY_TAG='Tutorial02' LIMIT 10;
You can also use the job history on the Studio page to view the execution status of query jobs.
Step04 Use Python Tasks for Concurrent Queries
Test concurrent queries using Python tasks to observe the query performance and elastic concurrency expansion capabilities of the analytical cluster under continuous dynamic concurrency.
-
In the Studio development module, create a Python task
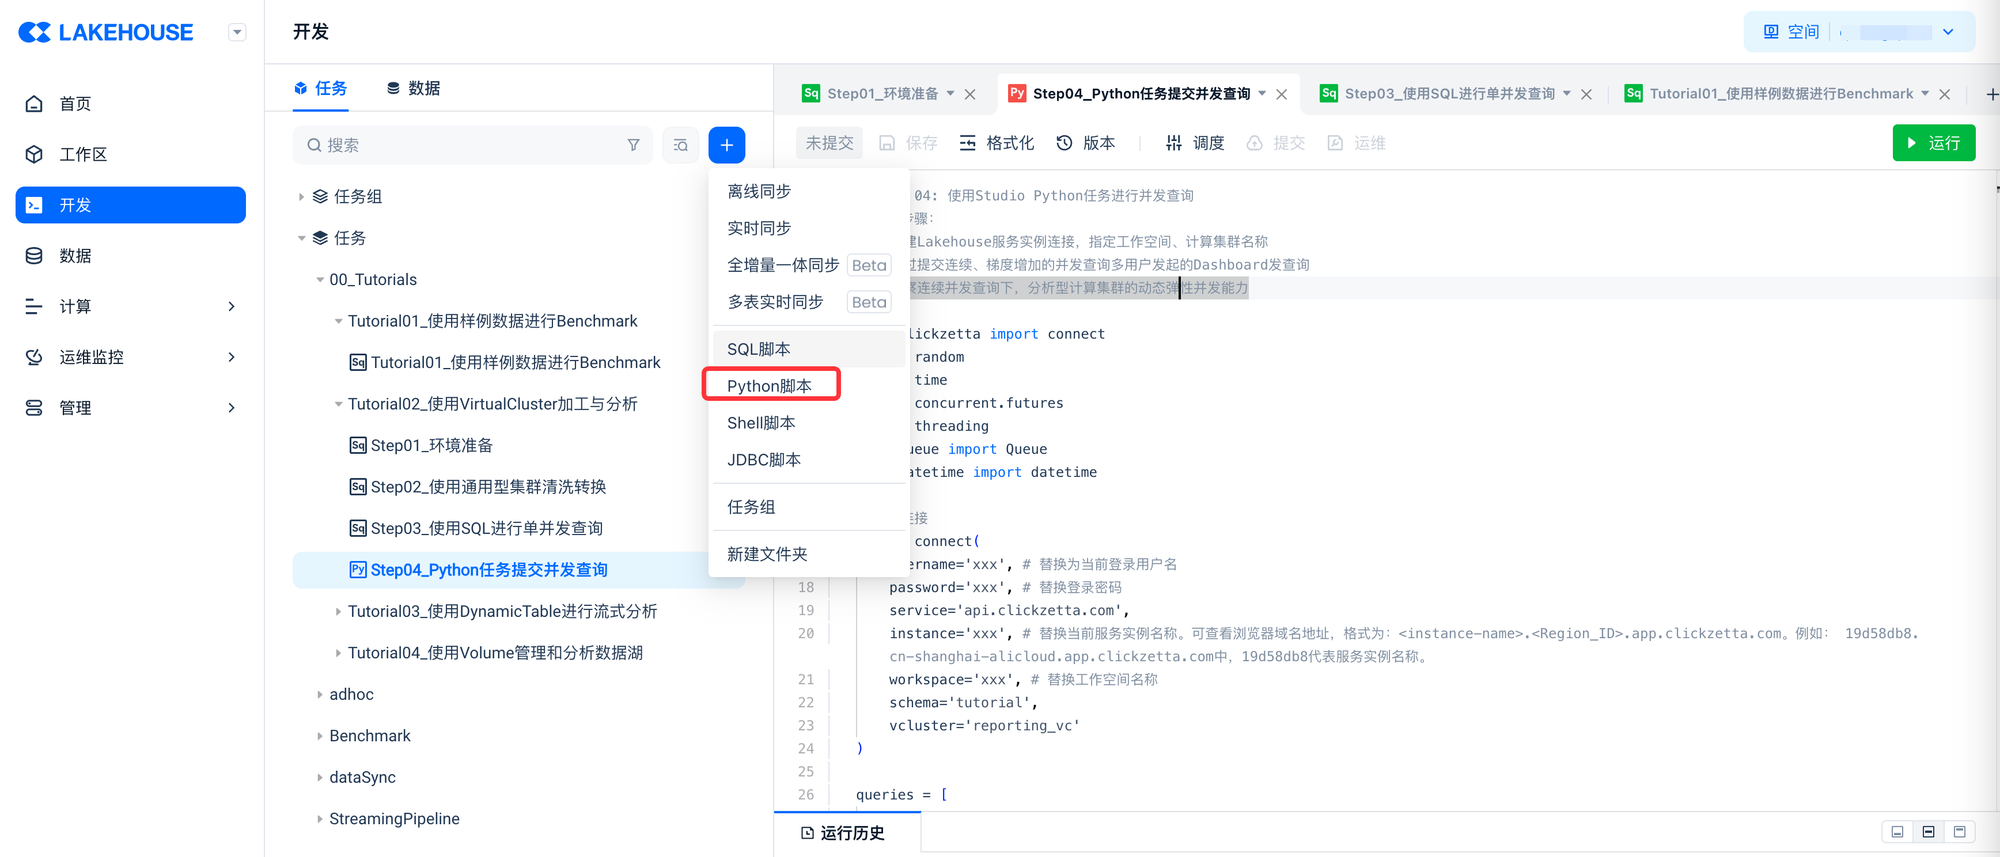
-
Write a concurrent test script using the Lakehouse Python SDK
The script in this tutorial implements the following processing logic
- Create a Lakehouse service instance connection, specifying the workspace and compute cluster name
- Submit continuous, incrementally increasing concurrent queries initiated by multiple users to the Dashboard
- Collect and print the latency under concurrent queries and the changes in the elastic expansion state of computing resources
# Step 04: Use Studio Python task for concurrent queries
# Steps:
# 1. Create a Lakehouse service instance connection, specifying the workspace and compute cluster name
# 2. Submit continuous, gradient-increasing concurrent queries initiated by multiple users to the Dashboard
# 3. Observe the dynamic elastic concurrency capability of the analytical compute cluster under continuous concurrent queries
#
from clickzetta import connect
import random
import time
import concurrent.futures
import threading
from queue import Queue
from datetime import datetime

# Establish connection
conn = connect(
    username='xxx', # Replace with the current login username
    password='xxx', # Replace with the login password
    service='api.singdata.com',
    instance='xxx', # Replace with the current service instance name. You can check the browser domain address, the format is: <instance-name>.<Region_ID>.app.singdata.com. For example: in 19d58db8.cn-shanghai-alicloud.app.singdata.com, 19d58db8 represents the service instance name.
    workspace='xxx', # Replace with the workspace name
    schema='tutorial',
    vcluster='reporting_vc'
)

queries = [
    """
    SELECT * FROM tutorial.mart_trips_pattern_by_time ORDER BY HOUR ASC;
    """,
    """
    SELECT * FROM tutorial.mart_trips_pattern_by_dayofweek ORDER BY day_of_week ASC;
    """,
    """
    SELECT * FROM tutorial.mart_trips_pattern_by_pickup_location ORDER BY trip_count DESC LIMIT 10;
    """,
    """
    SELECT * FROM tutorial.mart_trips_pattern_by_dropoff_location ORDER BY trip_count DESC LIMIT 10;
    """,
    """
    SELECT * FROM tutorial.mart_trips_per_day WHERE CONCAT(YEAR(date) , MONTH(date)) = '202110' ORDER BY date;
    """,
    """
    SELECT * FROM tutorial.mart_trips_driver_pay_per_company WHERE substr(year_month,0,4)='2021' ORDER BY year_month ASC;
    """
]
# Submit query and measure latency
def submit_query_and_measure_latency(query):
    # Create cursor object
    cursor = conn.cursor()
    start_time = time.time()
    # Execute SQL query
    cursor.execute(query)
    # Fetch query results
    results = cursor.fetchall()
    latency = time.time() - start_time
    return latency

# Query task
def query_task(barrier, query_queue, all_latencies):
    while True:
        # Wait for all threads to be ready
        barrier.wait()

        # Submit query task
        query = query_queue.get()
        if query is None:
            break
        latency = submit_query_and_measure_latency(query)
        all_latencies.append(latency)
        query_queue.task_done()

# Check the dynamic changes in the elastic concurrency configuration of the compute cluster
def check_cluster_concurrency_scaling():
    cursor = conn.cursor()
    # Execute SQL query
    cursor.execute('desc vcluster reporting_vc;')
    # Fetch query results
    results = cursor.fetchall()
    for row in results:
        if row[0] == 'current_replicas':
            print(row)

# Main function
if __name__ == "__main__":
    num_concurrent_list = [4, 8, 12, 16]  # Different concurrency levels
    rounds = 30
    for num_threads in num_concurrent_list:
        print(f"---Running with {num_threads} concurrent queries:---")
        # Shared list to store results from all threads
        all_latencies = []

        # Create query queue
        query_queue = Queue()

        # Put query tasks into the queue
        for _ in range(num_threads):
            for _ in range(rounds):
                query = random.choice(queries)
                query_queue.put(query)

        # Create a Barrier to wait for all threads to be ready simultaneously
        barrier = threading.Barrier(num_threads)

        # Create and start threads
        threads = []
        results = []
        start_times = []
        for _ in range(num_threads):
            thread = threading.Thread(target=query_task, args=(barrier, query_queue, all_latencies))
            thread.start()
            threads.append(thread)

        # Wait for all query tasks to complete
        query_queue.join()

        # Stop threads
        for _ in range(num_threads):
            query_queue.put(None)
        for thread in threads:
            thread.join()

        # Calculate metrics
        all_latencies.sort()
        avg_latency = sum(all_latencies) / len(all_latencies)
        p95_index = int(len(all_latencies) * 0.95)
        p95_latency = all_latencies[p95_index]
        p99_index = int(len(all_latencies) * 0.99)
        p99_latency = all_latencies[p99_index]
        qps = len(all_latencies) / sum(all_latencies)

        # Print results
        print("Total Queries:", len(all_latencies))
        print("Average Latency:", avg_latency)
        print("P95 Latency:", p95_latency)
        print("P99 Latency:", p99_latency)
        print("Queries per Second (QPS):", qps)
        check_cluster_concurrency_scaling()
When setting the maximum concurrency of a single Replica for reporting_vc to 4, the printed results are as follows:
- --Running with 4 concurrent queries:--- Total Queries: 120 Average Latency: 0.2201933761437734 P95 Latency: 0.43064022064208984 P99 Latency: 0.683488130569458 Queries per Second (QPS): 4.5414626793635176 ('current_replicas', '1') ---Running with 8 concurrent queries:--- Total Queries: 240 Average Latency: 0.20615292688210804 P95 Latency: 0.2397170066833496 P99 Latency: 0.4295358657836914 Queries per Second (QPS): 4.850767898977571 ('current_replicas', '2') ---Running with 12 concurrent queries:--- Total Queries: 360 Average Latency: 0.2232776681582133 P95 Latency: 0.27333879470825195 P99 Latency: 0.46774768829345703 Queries per Second (QPS): 4.478728250115035 ('current_replicas', '3') ---Running with 16 concurrent queries:--- Total Queries: 480 Average Latency: 0.23430742422739664 P95 Latency: 0.25676393508911133 P99 Latency: 0.4392051696777344 Queries per Second (QPS): 4.267897200856488 ('current_replicas', '4')
The client simulates four rounds of concurrent queries with 4, 8, 12, and 16 concurrent queries respectively, with each concurrency level submitting 30 queries consecutively per round. It can be observed that reporting_vc dynamically increases the number of Replicas based on the client's concurrency level, ensuring that the average latency, P95, P99, and QPS metrics remain stable under different concurrency levels without the user being aware of the cluster's dynamic scaling.


