Analytics Agent Answer Accuracy Improvement Best Practices
Addressing the most common question: what techniques can improve answer accuracy, which approach fits which scenario, and how to manage them?
0. Reduce Noise at the Architecture Level: Partition Analysis Domains
The single most effective first step to improving accuracy is not tuning parameters — it is narrowing the model's "search space." When tables from all business lines are piled together, the model has to guess the right table from dozens or even hundreds of candidates every time it answers — the more noise, the higher the chance of selecting the wrong one.
Analysis domains let you split data by business topic: one domain for sales, one for HR, one for supply chain. Each domain contains only its relevant tables, metrics, and knowledge. When a user asks a question within a domain, the model reasons only within that domain's scope, which naturally improves accuracy. Domains can also be bound to users, providing built-in data isolation — users from different departments can only see data within their own domain.
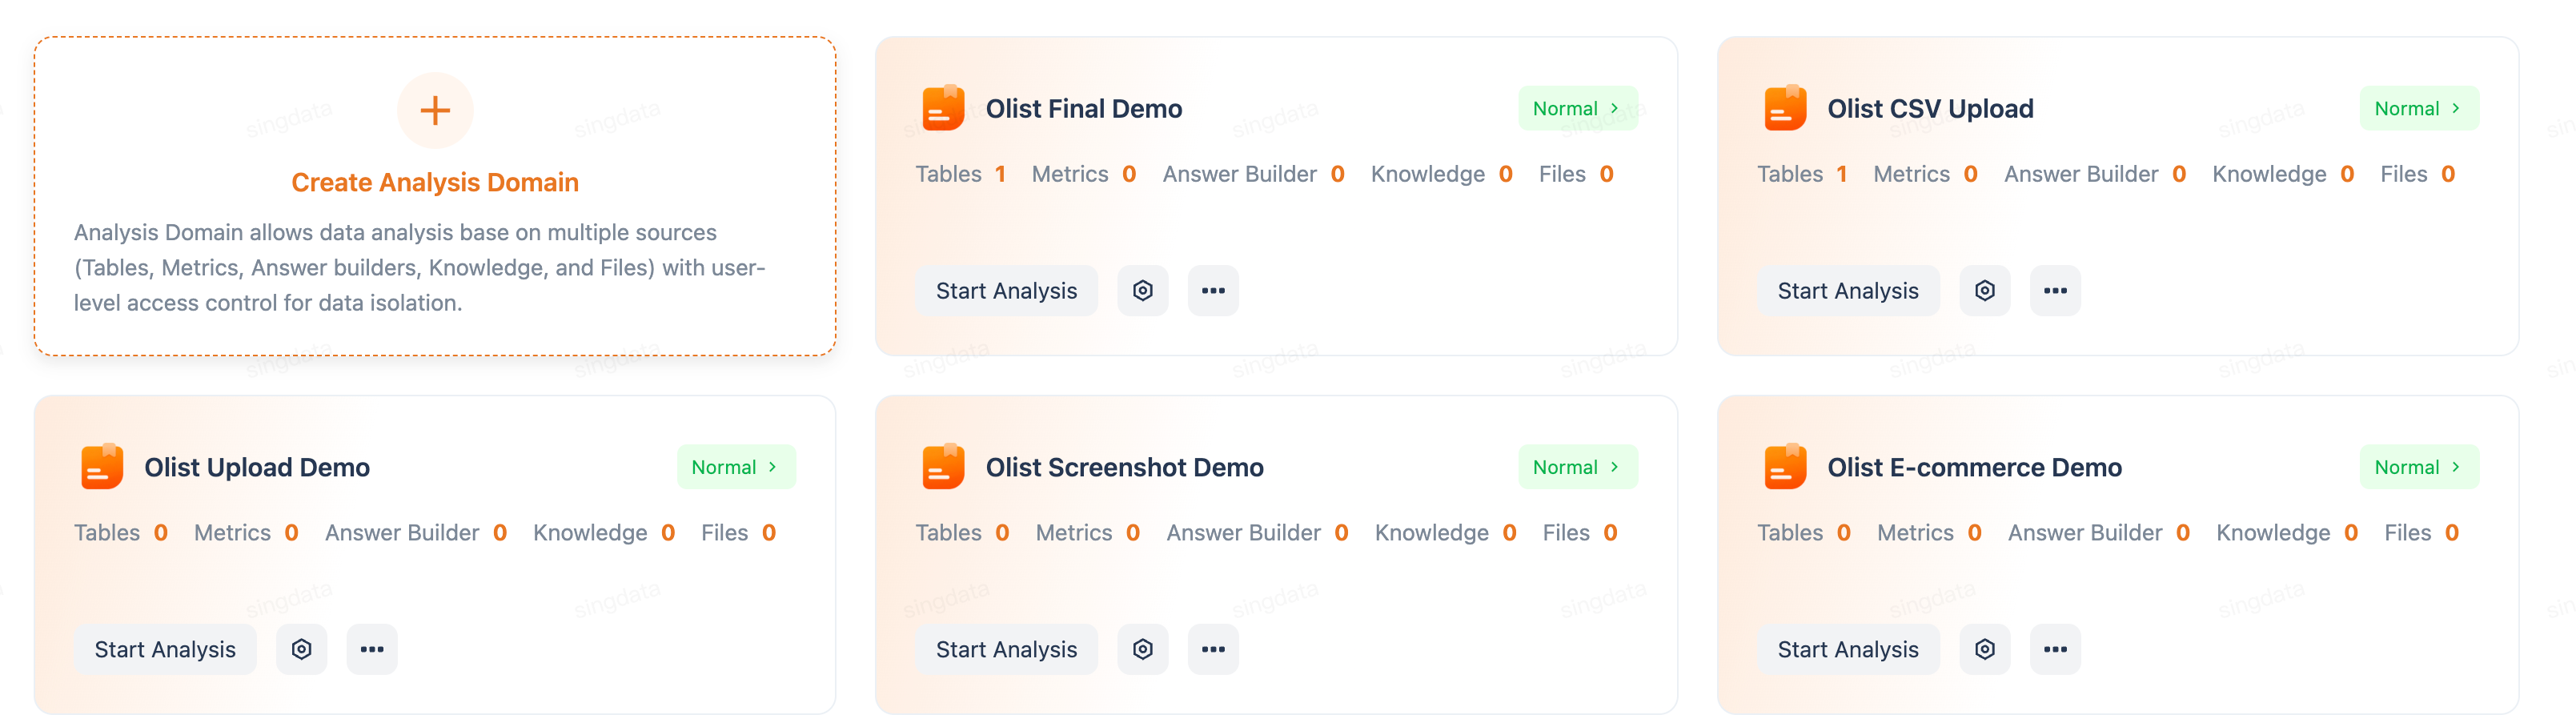
The Analysis page shows all analysis domains, each displaying the count of tables, metrics, answer builders, and knowledge items it contains. Click New Analysis Domain to create one, then associate data tables and users in the domain settings.
1. What Capabilities Improve Accuracy?
Data Analytics Agent (DataGPT) provides 4 core capabilities to feed more business context to the model and improve answer accuracy:
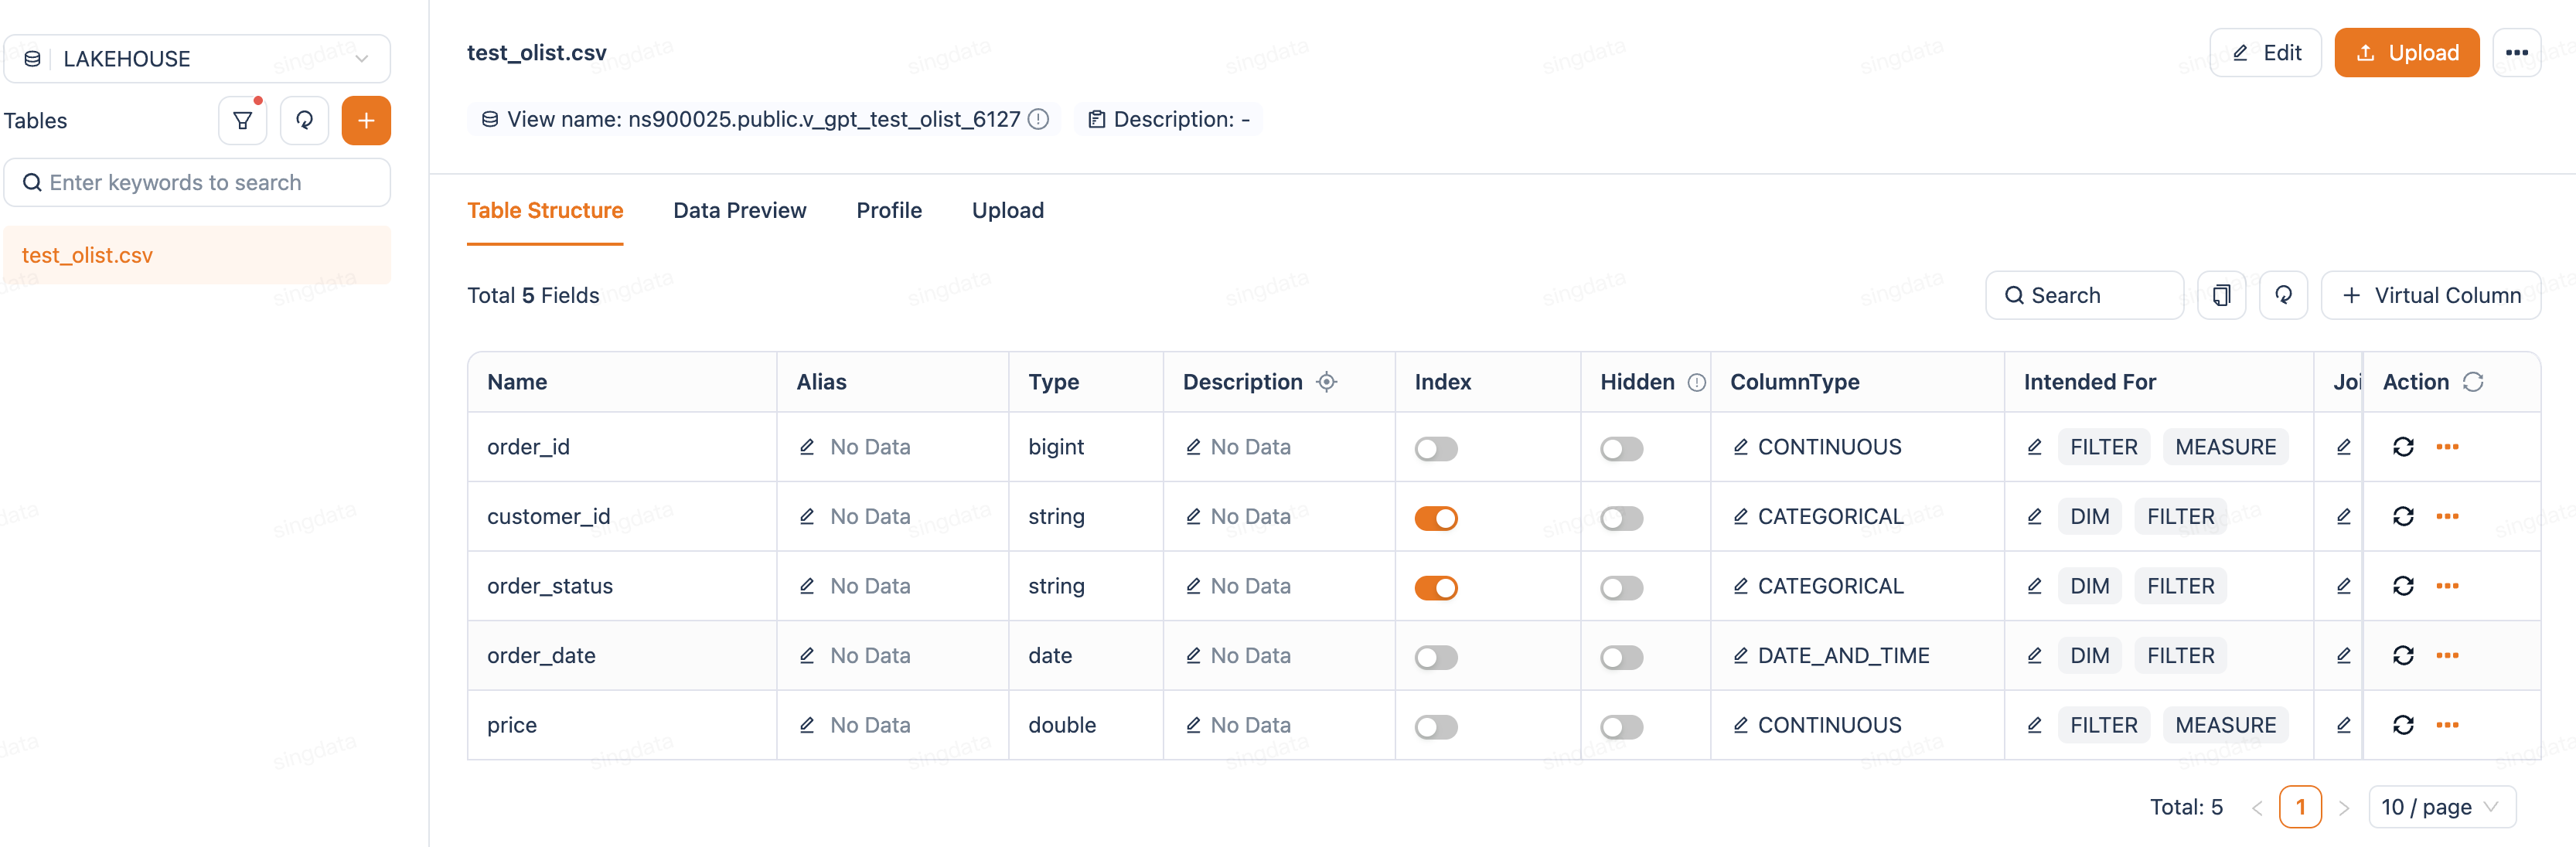
1. Table/Column Schema Descriptions
| Configuration | Purpose | Example |
|---|---|---|
| Table description | Tell the model what this table contains | "Daily sales transaction data for all stores in the Hong Kong region" |
| Column alias | Help the model understand different names for the same field | Column rev_amt → alias "revenue", "turnover" |
| Column description | Explain business meaning and value rules for a column | "payment_type: payment method, values include cash/card/octopus" |
| Hidden columns | When a table has many fields, some columns are meaningless for business analysis (e.g., system primary keys, ETL timestamps, internal codes). Hiding them prevents these columns from participating in AI Q&A, reducing the chance of wrong column selection | Use when: the table has many technical fields that confuse the model; or certain sensitive fields should not be referenced by AI |
| Virtual columns | When schema changes require AI to adapt its understanding, create a virtual column via a SQL expression without modifying the underlying table | Use when: a raw field needs transformation to make its business meaning more understandable to AI |
2. Knowledge (Knowledge Base / Analysis Documents)
Business background knowledge provided as files, injected into the conversation context via RAG retrieval.
Suitable content for the knowledge base:
- Business rules
- Data dictionaries / code mapping tables
- Industry terminology explanations
- Analysis methodologies / calculation definitions
- FAQ
- Content that should only be recalled in specific scenarios
Core value: Helps the model understand the business logic behind the data, not just the data structure.
3. Metrics / Answer Builder
Pre-defined calculation formulas with alias matching, ensuring consistent metric definitions. Specifically:
- Metrics: used to define aggregate calculations (e.g., SUM, AVG)
- Answer Builder: used to define queries involving multi-table JOINs and complex filter conditions
| Element | Description | Screenshot demo |
|---|---|---|
| Metric name | e.g., "Average Order Value" |  |
| Calculation logic | SUM(revenue) / COUNT(DISTINCT order_id) | 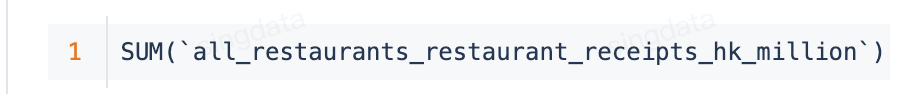 |
| Aliases | Help the model understand different names for the same concept | 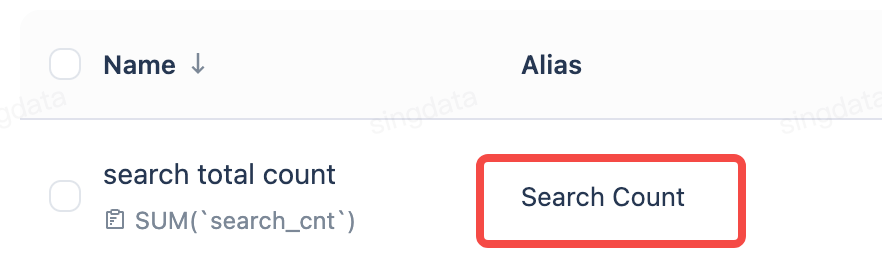 |
| Auto-generate metrics | Basic aggregate metrics (SUM, COUNT, etc.) can already be auto-generated for selected tables; context-aware metric insights and auto-generation for smarter metric recommendations are coming soon |
Core value: Ensures key business metrics are calculated consistently and accurately — the same SQL is generated every time the same question is asked.
4. Domain Prompt
A system prompt at the analysis domain level, functioning as a "role definition" and "behavioral guidelines" for the model.
- Role definition: "You are a data analyst specializing in the Hong Kong food and beverage industry"
- Response guidelines: "Currency defaults to HKD, date format is YYYY-MM-DD"
- Business constraints: "When calculating same-store growth, include only stores that have been open for at least 12 months"
- Output preferences: "For trend-related questions, prefer line charts"
Core value: Sets global rules so you do not have to repeat preconditions every conversation.
2. Which Capability Fits Which Scenario? (Scenario → Capability Mapping)
| Scenario / Problem Type | Recommended Capability | Why |
|---|---|---|
| Many tables, model frequently picks wrong table | Partition analysis domains | Narrows the model's selection space |
| Different teams need data isolation | Partition analysis domains | Domain-user binding provides natural isolation |
| Model picks wrong table or column | Table/column Schema descriptions | Unclear descriptions cause mismatches |
| Filter values are wrong (e.g., full name used but data stores abbreviations) | Column value index | Enables fuzzy matching |
| Calculation logic is wrong (e.g., "gross profit" computed incorrectly) | Metrics | Pre-defines the exact formula |
| Complex calculation logic (multi-table JOIN + conditional filters) | Answer Builder | Provides a SQL template |
| Model does not understand business terms (e.g., "table turnover rate") | Knowledge base | Provides terminology explanation documents |
| Background knowledge needed to answer (e.g., "Why did March revenue drop?") | Knowledge base | Provides business context documents |
| Preconditions have to be repeated every conversation | Domain prompt | Set once, applied globally |
| Same metric has multiple names | Metric alias / column alias | Supports multiple expression matching |
Decision Flow
3. How to Use? (Knowledge Base Management)
3.1 Knowledge Base Structure
The new knowledge base uses a hierarchical folder structure (similar to Feishu/Lark knowledge base):
3.2 Content Creation Methods
| Method | Suitable Scenario |
|---|---|
| Create directly | Manually write business rules, terminology explanations, etc. |
| Upload locally | You already have PDF/Word/Excel/Markdown documents |
| Import from cloud storage | Bulk import existing documents from OSS/S3 |
3.3 Associate with Analysis Domain (Critical!)
Knowledge base content must be associated with an analysis domain before conversations in that domain can retrieve it:
- Associate at the folder level → sub-files inherit automatically
- One file can be associated with multiple analysis domains
- Unassociated files will not be retrieved by any conversation
Best practices:
- Create folders by business topic, associate domains at the folder level
- Associate general knowledge (e.g., company glossary) with all analysis domains
- Associate domain-specific knowledge only with the corresponding domain
3.4 What Content Belongs in the Knowledge Base?
Content suitable for the knowledge base:
| Content Type | Example |
|---|---|
| Business rules | Table turnover rate = tables served / total tables; average order value = revenue / customer count |
| Code mapping | Store code A01 = Causeway Bay store, A02 = Mong Kok store |
| Industry terminology | Definitions of "dine-in", "delivery", "table turnover", "service time" |
| Data definitions | "Valid orders" exclude refunded orders and test orders |
| Analysis methodology | Same-store growth counts only stores open for at least 12 months |
| Common FAQ | "Why does report data not match accounting?" → Because the report excludes tax |
| Background information | In Q1 2026 the company adjusted stores: 3 new openings, 2 closures |
Content not suitable for the knowledge base:
| Content Type | What to Use Instead |
|---|---|
| Exact calculation formulas for metrics | → Use the "Metrics" feature |
| Complex SQL templates | → Use the "Answer Builder" |
| Column aliases and descriptions | → Use "Schema Descriptions" |
| Global response guidelines | → Use the "Domain Prompt" |
3.5 Management Recommendations
| Recommendation | Details |
|---|---|
| Use folders by topic | Easier to manage and bulk-associate with analysis domains |
| Keep documents concise | Each file focuses on one topic; avoid large all-in-one documents |
| Update regularly | Sync the knowledge base when business rules change |
| Use meaningful names | File names should reflect content, e.g., "table-turnover-rate-calculation-rules.md" |
| Validate before rolling out | Test a few questions after adding knowledge to confirm the effect before wide deployment |
4. Summary: How the 4 Capabilities Work Together
In one sentence:
- Schema descriptions help the model "find the right data"
- Metrics help the model "calculate the right numbers"
- Knowledge base helps the model "understand the business"
- Domain prompt helps the model "follow the rules"
Using all four together yields the highest accuracy.